Working to Eradicate A Painful Parasite

By Kim Smiley

The lifecycle of the Guinea worm is the stuff of nightmares.  This parasite is ingested by a host as larvae, mate and mature inside the host and then the adult female painfully emerges to lay her eggs. The adult female is between two to three feet long and the thickness of a spaghetti noodle.  The only way to get rid of the parasite is to wrap it around a stick and slowly pull it out, a process that takes several weeks or even months.

Individuals who are infected by this parasite can suffer for months, making it difficult to work and feed their families.  There is no immunity to Guinea worms so it’s possible for people to suffer year after year if they continue to ingest the larvae of the Guinea worms.  There is also no drug to treat Guinea worm disease and there is no vaccine that prevents infections.

But there is hope in the fight against this excruciating disease.  The number of cases of Guinea worm disease has decreased dramatically.  In 1986 there were an estimated 3.5 million cases of Guinea worm disease spread across 21 countries in Asia and Africa.  In 2011, there were only 1,058 reported cases of Guinea worm disease in four African countries.

How was this possible?  The first step in answering that question is to understand more about the disease.  The problem of Guinea worm disease can be illustrated by building a Cause Map, an intuitive root cause analysis format.  By asking “Why” questions, causes can be added to the Cause Map and the problem can be analyzed.    Why are people getting the disease?  People are drinking water that is contaminated with copepods, also called water fleas, which are infested with larvae of Guinea worms.  There is also typically no other supply of safe drinking water and the water wasn’t treated or filtered prior to consumption.

Painful blisters form when the female Guinea worm emerges from the body and people put their sores into the same water used for drinking (because it is usually the only water available) to help relieve the burning sensation.   The female Guinea worm then releases hundreds of thousands of guinea worm larvae once she senses water.  Guinea worm larvae is eaten by the water fleas.  The infected water fleas are small and ingested along with the water, which restarts the whole process.

This process had been going on for thousands of years, affecting millions and millions of people.  Its remains have even been found in Egyptian mummies.  But simple changes have nearly eliminated the disease.  In fact, Guinea worm disease is predicted to be the first human disease ever eradicated without a vaccine and only human disease to be eradicated other than small-pox.

Relatively simple changes have made all the difference in the world.  People were educated about how to prevent the disease.  Millions of straws with filters were handed out to villagers to strain out the infected water fleas and prevent the parasite from entering the body.  Efforts were also made to treat water with larvicide and provide access to uncontaminated drinking water.

Without new hosts, the Guinea worm larvae died.  Once the lifecycle was broken, the disease disappeared from many regions.  There are now only four countries that reported any cases of the disease last year, the vast number being in war torn South Sudan where public health efforts have been difficult to sustain.

Click on “Download PDF” above to view a high level Cause Map of this issue

Donated Kidney Trashed

By ThinkReliability Staff

On August 10, 2012, a living donor’s kidney was thrown out, instead of being transplanted as planned.  The incident was chalked up to “human error”, which is almost certainly part of the problem . . . but definitely not all of it.

This extremely rare, but serious, event is being analyzed by several oversight agencies, as well as a contractor hired by the medical center in Ohio where the event took place, to ensure that needed improvements are identified and put into place so this type of incident doesn’t happen again.  We can examine the currently known information in a visual root cause analysis, or Cause Map.  To do so, we begin with the impacted goals.

There are many goals that were impacted as a result of this error.  Firstly, the patient safety goal was impacted because the patient did not receive the transplanted kidney.  This can also be considered an impact to the patient services goal.  Three personnel from the hospital were placed on administrative leave as a result of the incident.  This results in an impact to employees.  The compliance goal is impacted because this event has resulted in a review by several oversight agencies.  The living kidney donor program is currently shut down for review, which can be considered an impact to the organization goal.  The kidney was disposed of improperly, which is an impact to the environmental goal.  (Medical waste has strict requirements for disposal.)   The loss of the donated kidney can be considered an impact to the property goal.  Personnel time was taken both to attempt to resuscitate the kidney and to participate in an independent review of the donor program.  These can both be considered impacts to the labor/time goal.

Once we have determined the impacts to the goals, we can ask “Why” questions to develop the cause-and-effect relationships that led to these impacts.  In this case, the patient did not receive a kidney transplant because the kidney was thrown out and because of concern about the kidney’s viability.  Part of this concern was the delay in actually finding the kidney, likely due to the fact that it was disposed of improperly.  The reason given by the medical center for the disposal of the kidney is “human error”.  However, there is ordinarily a support system involved in organ transplants that would minimize these types of errors.  Certainly the fact that the program has been stopped and three employees – at least one of whom was not directly involved in the transplant operation – were placed on administrative leave suggest that the organization is looking at more than just a screw-up by one person acting alone.

Specifically, the investigation should look at communication – was the nurse who disposed of the organ told it was destined for transplant?  Was there a surgical time-out immediately prior to the removal with the entire operating team that discussed the plan for the kidney?  Also the training and preparation of the surgical team should be investigated.  Had the team been properly trained and prepped for this type of surgery?  The fact that it was done frequently at this facility doesn’t mean that adequate training was in place.  What about the procedure for treatment and supervision of donated organs?  Donated organs have to be treated in a very particular way to ensure their viability for the transplant patient.  Who, if anyone, was responsible for ensuring that the organ was prepared in a proper way for transplant?  Were they involved in the surgical time-out?  Lastly, because an error was made with the disposal procedure, the procedure, training and communication regarding disposal of medical waste needs to be analyzed to ensure it is adequate. The hope is that by doing a thorough review – and improvement – of policies, procedures, training and communication at the facility, it will not only reduce the risk of this type of error, but provide improvement in many other aspects of the care provided as well.

To view the Outline and Cause Map, please click “Download PDF” above.

Possible Link Between Antibiotics and Obesity

By Kim Smiley

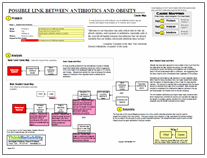
A study recently published in the International Journal of Obesity found that infants given antibiotics before six months of age were 22 % more likely to be overweight between the ages of 10 months and 3 years.  Researchers believe this may be because the natural balance of bacteria in their digestive tracts is altered by the antibiotics.

Obesity has long been assumed to be a matter of too much food into the body while too few calories are burned, but new studies. including the recent one finding a link between use of antibiotics early in life and body weight later in childhood,  are suggesting that the issue may be more complicated than it appears on the surface.

Scientists are still studying how bacteria in human digestive tracts affect how the body processes food, but many researchers believe that the balance of bacteria plays a role in how the body absorbs calories.  The amount of calories that a body absorbs from the same amount of identical food may not be a constant.  More studies are needed to understand the relationship between bacteria in the gut and body weight, but studies done so far are intriguing.

The link between antibiotics and higher body mass remained even when researchers controlled for factors such as what the baby ate, the weight of a baby’s parents, whether the mother smoked while pregnant, and the family’s socioeconomic status.  Researchers did note that the study found an association and not a cause-effect link and that further studies are needed, but there seems to be a relationship between how antibiotics affect the body and body mass.

More research is needed to fully understand this issue, but this study is an interesting step to better understanding the causes of childhood obesity.  On the downloadable PDF, we have created a Cause Map, or visual root cause analysis, to show the possible cause-and-effect relationships between use of antibotics in early enfancy and childhood obesity.

In this specific study used to build this example, the researchers were quick to point out that infants should be given antibiotics if they are needed, but it’s important to understand how the medication may be affecting bodies, especially very young bodies.

To view a Cause Map of this issue, click on “Download PDF”.

At Least 31 Patients Contracted Hepatitis C

by Kim Smiley

Testing is still ongoing, but at least 31 people have contracted hepatitis C from contaminated syringes at a New Hampshire cardiac catheterization lab.  A previous blog discussed the outbreak when it was initially announced that four patients who had used the same cardiac catheterization lab had tested positive for the same strain of hepatitis C, but more information has been released and the Cause Map should be updated to incorporate all the relevant details.  One of the strengths of a Cause Map, a visual root cause analysis, is that it can be updated relatively quickly to document important information as it becomes available.  In this example, investigators are continuing to work to understand the issues involved, but two new significant pieces of information should be added to the Cause Map.

The source of the hepatitis C has been determined by investigators.  Investigators found that a medical technician with hepatitis C contaminated syringes that were then used on patients.  The medical technician is a drug addict who used the syringes because they were filled with Fentanyl, an anesthetic far more powerful than morphine.  Hepatitis C is spread through blood to blood contact so syringes contained with hepatitis C are a major health hazard that are capable of spreading the disease. The syringes were not secured so he was able to attain them.  He then used them, refilled them with saline or another liquid and replaced them without any other member of the staff noticing.

Investigators have also learned that the medical technician responsible for the contamination has worked in 18 hospitals in seven other states during the last 10 years.  It’s not known when the medical technician contracted hepatitis C, but investigators believe he had a positive test for hepatitis C in June 2010.  This means that the investigation needs to be expanded and that many more people may need to be tested.

This article contains information about what facilities the medical technician worked at and the timeline for his employment.  To view an updated high level “Cause Map”, click here.

Consumption of Small Cigars Increases

By Kim Smiley

A study by the CDC has found a decrease in cigarette smoking, but a corresponding increase in the use of other tobacco products.  Cigarette smoking declined 33% between 2000 and 2011 which would be cause for celebration except for the fact that use of other kinds of tobacco grew by 123%.  This seems to be an example of unintended consequences where the attempt to control one problem changed behavior in an unexpected way.

A Cause Map, or visual root cause analysis, can be used to help explain this situation.  Building a Cause Map can illuminate the cause-and-effect relationships between the different factors that contributed to an incident.  To begin a Cause Map, the impacts to organizational goals are determined and then “why” questions are asked to add Causes.  In this example, we’ll focus on the increase in the use of small cigars since they are the tobacco alternative most similar to cigarettes.  We’ll also focus on the Safety Goal since public health is affected by the increasing use of small cigars, although there are certainly other issues such as missed tax revenue worth considering in a more detailed Cause map.

Why is the risk to public health increasing?  This occurs because more people are using small cigars and they have similar health risks to cigarettes because they contain the same toxic chemicals.  Why are more people using small cigars?  Small cigars smoke similarly to cigarettes, are far cheaper than cigarettes and can taste better.

Small cigars are slightly larger than cigarettes, but are similar enough in size to provide a similar smoking experience.  They are far less expensive than cigarettes because they are in a different tax category because of their slightly larger size and the fact that not all tobacco products are equally taxed.  The price difference is significant; small cigars may cost as little as $1.40 a pack while cigarettes sell for $4 or $5 a pack since they are highly taxed to discourage smoking.

Cigars can also taste better because manufacturers are allowed to add flavorings such as grape and chocolate to small cigars, but they are not allowed to add them to cigarettes.  The Food and Drug Administration has regulations that bar adding flavoring to tobacco, but these do not apply to cigars and pipe tobacco.

From 2010 to 2011, the overall use of smoked-tobacco decreased by less than 1%.
It appears that attempts to discourage smoking cigarettes with high taxes just pushed some people into buying cheaper alternatives.  One potential solution to this issue would be to equalize the taxes and regulations on all types of tobacco.

To view a high level Cause Map of this example, click on “Download PDF” above.

DC Searches for Solutions to Slow the HIV Epidemic

By Kim Smiley

Washington DC is trying some new methods to help fight the AIDS epidemic.  DC has long had one of the highest rates of HIV infection in the United States, but there is hope that these new techniques might change that fact.

This issue can be built into a Cause Map, a visual root cause analysis.  A Cause Map shows the relationship because the causes that contribute to an issue and can also show how potential solutions would impact those causes.  To view a high level Cause Map of this issue, click on “Download PDF” above.

The focus of DC’s fight against HIV is treatment, which seems to be the key to controlling the HIV infection rate.  While researchers are still searching for a cure, simply treating people infected with HIV has the potential to dramatically slow down the epidemic.  HIV positive patients who consistently take their drugs lower their chances of infecting others by 96% because the amount of virus in their bloodstream is significantly lower.

The first step in treating infected people is to identify who is infected.  Testing is also important because the earlier patients can be identified; the more effective treatment is typically.  Washington DC has increased testing efforts in order to identify the estimated 5,000 people who live in the DC area and are unaware that they are infected.  People are now being paid to get tested and HIV tests are being offered in a number of new locations such as grocery stores, high schools, on corners where addicts gather, and at the DMV.  There are also efforts to focus testing on the highest risk populations by paying for referrals and social network tracing.

The next area of difficulty is getting patients consistent treatment.  Only 29% of people diagnosed in DC take their drugs every day, which is about average for an American city.  Washington DC is working to track HIV patients, who are typically more transient than the rest of the population and to help get treatment to as many people as possible.

Another cause of the AIDS epidemic that Washington DC is working to improve is to slow the spread of the virus itself.  Typical transmission routes for HIV are unprotected sex and use of dirty needles.  Last year, five million male and female condoms were given away in the DC area.  There were also more than 300,000 clean needles given away.

These innovative new programs seem to be having a positive impact on the epidemic. New cases have fallen to 835 from 1,103 in 2006.  The number of AIDS test administered has greatly increased.  Only time will tell how effective these solutions have been at slowing down the HIV epidemic in the nation’s capital.

The Low Survival Rate of Pancreatic Cancer

By Kim Smiley

Sally Ride, the first US woman in space and a national hero, died after a 17-month battle against pancreatic cancer on July 21, 2012.  Pancreatic cancer is a particularly deadly cancer with only a 6% five-year survival rate.  This disease also affects many people.  In 2010 alone, an estimated 43,000 people in the US were diagnosed with pancreatic cancer.

The reasons that pancreatic cancer is so deadly can be explored by building a Cause Map, a visual root cause analysis.  The first step in building a Cause Map is outlining the problem which includes defining how the problem impacts the organizational goals.  In this example, the primary goal considered is the impact to the safely goal since pancreatic cancer has such a low survival rate.

In order to build the Cause Map, “why” questions are asked and the answers are added to the Cause Map.  Why does pancreatic cancer have such a low survival rate?  The survival rate is low because the cancer has usually spread beyond the pancreas by the time it is detected and pancreatic cancer is difficult to treat.  The cancer has typically spread before detection because there are very few symptoms in the early stages of the cancer and any symptoms that do exist are usually vague, like aches and pains that could easily be attributed to other illnesses.  There is also no screening test like there are for breast or prostate cancer to detect pancreatic cancer at this time.

Pancreatic cancers are difficult to treat for several reasons.  First, pancreatic cancers are resistant to chemotherapy.  The best course of treatment is typically removal of the tumor, but many cases are caught too late for the tumor to be removed because the cancer has usually spread by the time it is detected.

Researchers are working on improving the survival rate for pancreatic cancer.  There are some promising studies that show it may be possible to develop a screening test that could detect pancreatic cancer at earlier stages, which could significantly improve the chances for survival.

To view a high level Cause Map of this issue, click on “Download PDF” above.

Delay in Treatment for Sepsis Results in Death of a Child

By ThinkReliability Staff

On April 1, 2012, a patient at a university medical center in New York died from sepsis.  The death was especially heartbreaking as the patient was 12 years old . . . and had been healthy just 4 days prior.  However, he had contracted a bacterial bloodstream infection (sepsis), which has a high mortality rate (nearly 40%, according to the United Hospital Fund) that grows with every passing hour.  (A study cited by the New York Times found that the survival rate decreases by 7.6% every hour before antibiotics are given.)  With response time so crucial to patient outcome, rapid action at every step of the process is required.

We can look at this incident in a visual root cause analysis, or Cause Map.  The purpose of this map is not to assign blame, but rather to discover and document causes in the hope of finding solutions to reduce the occurrence of this type of issue.

We begin with the impacts to the goals.  In this case, the patient safety goal was impacted due to a patient death.  Because of the high potential for emotional impact to providers, employees are also impacted.    The potential for a lawsuit is an impact to the organizational goal, and the initial misdiagnosis of the patient is an impact to the patient services goal.

We begin with the patient safety goal and ask “Why” questions to develop cause-and-effect relationships that will show all the causes of the incident.  The patient died of severe septic shock and insufficient intervention.  (Had intervention come earlier, the patient may have lived.)  The onset of the sepsis appears to have been a cut acquired at school, which was bandaged, but possibly not cleaned, likely due to the lack of severity of the initial injury.  Delay of treatment allowed the sepsis to overwhelm the immune system.  The treatment was delayed due to an initial misdiagnosis of dehydration.     Sepsis is particularly difficult to diagnose because many of its symptoms mirror symptoms of other more common ailments.  Information was not shared between providers – the child’s primary care pediatrician, parents, and the hospital staff, which may have contributed to the difficulty in diagnosis.  Test results taken at the hospital came in after discharge and were not shared by phone with the primary provider or parents.  Additionally, even after lab results from the hospital suggested that the white blood cell count was abnormally high, indicating infection, no action was taken.

From this very basic, high level map, at least four areas of specific improvement can be noted.  Protocol at the school for injuries that involve cuts – even if they seem minor – should include cleaning or disinfection.   The hospital should have – and follow – protocol for that specifies action to be taken upon receipt of lab results.   This protocol should include documenting and sharing test results with other providers and caregivers.  Because of the difficulty in diagnosing sepsis, and the importance of quick action, the United Hospital Fund is current developing a STOP Sepsis Collaborative, which aims to “reduce mortality in patients with severe sepsis and septic shock by implementing a protocol-based approach to case identification and rapid treatment”.  Ideally, implementation of the results of this collaborative will reduce the risk of patient death from a situation like this tragic case.

To view the Outline, event Timeline, Cause Map, and Solutions, please click “Download PDF” above.  Or click here to read more.

Accidentally Ingested Wire Bristles

By Kim Smiley

There have been a number of documented cases of people accidentally swallowing wire bristles from the brushes commonly used to clean grills.  If ingested, the bristles can cause significant pain and have the potential to puncture organs, including the intestine which can lead to dangerous infections.  There isn’t a lot of data available to determine how often this occurs, but a recent report discussing six cases of ingested wire bristles at a single hospital in a one year period hint that this may be more common than many realize.

This issue can be analyzed by building a Cause Map or visual root cause analysis.  The first step in creating a Cause Map is to determine how the issue impacts the overall goals of an organization.  In this example, we’ll consider the organization the general public and the main impacted goal is the safety goal since there is a risk of serious health issues.  Causes are now added to the Cause Map by asking “why” questions.  Why is there a risk of serious health issues?  Because there is the potential to swallow a wire bristle and the wire bristle can do a lot of damage within the body.   (To view a high level Cause Map of this issue, click “Download PDF” above.)

Continuing the “why” questions, we would now ask “why” is there a potential to swallow a wire bristle?  This possibilities exists because people may inadvertently swallow the bristles without realizing it, the bristles come from wire brushes that are often used to clean residential grills and the bristles sometimes fall out of the brushes and stick to the grill.  People may inadvertently ingest the bristles because the bristles can stick to meat and the texture can hide the presence of the bristle.  Many people are also unaware of the potential danger of eating a wire bristle so they aren’t looking to find bristles.  Investigation into this issue has not found any defects that are causing bristles to fall out.  No one brand or type of grill brushes has been singled out as the culprit in these causes, but a worn grill brush is more likely to shed bristles than a new brush.

All six patients in the report did make full recoveries after treatment.  In three of the cases, the wire bristles were stuck in the throat and required only laryngoscopic removal; the other three cases required more invasive surgery to remove the object.

The best way to protect yourself from the possibility of this occurring is to inspect the grill after using a wire grill brush or to find another method to clean your grill.  The Consumer Product Safety Commission has asked that medical professions or consumers report any incidents of swallow grill brush bristles to http://www.saferproducts.gov to help monitor this issue.

Medical Laboratory Errors

By ThinkReliability Staff

Surprisingly, many of what are considered laboratory errors do not actually occur in the lab.  But errors related to laboratory testing can negatively impact patient care.  We can look at the impacts and causes of errors related to diagnostic testing in a Cause Map, which allows us to visually diagram cause-and-effect relationships.

We begin this type of root cause analysis by determining the impacts to the organization’s goals.  In this case, because we want to consider all possible sources of diagnostic errors in a proactive analysis, we will look at the generic goals for an organization that provides healthcare.  Diagnostic errors can cause an impact to the patient safety goal because of the risk of impact to patient treatment.  Employees’ abilities to do their job is impacted because they may be receiving incorrect information from lab testing. There is a risk of impact to the patient’s treatment, which is an impact to the patient services goal.  Additionally, there is a risk of performing unnecessary treatment as a result of incorrect testing results, which could impact both the property and labor goals.

Once we have determined the impacts to the organization’s goals (and there may be more impacts for specific incidents involving diagnostic testing errors), we can ask “Why” questions to determine the causes that result in these impacts.  We will begin with the patient safety goal impact.  The patient safety goal is impacted because of the risk of an impact to a patient’s treatment.  This includes the possibilities of a risk of delayed treatment, risk of not receiving needed treatment, and a risk of unnecessary treatment.  Delayed treatment can occur from a delayed diagnosis, which could result from either delayed or incorrect testing results.

Delay of testing results can be caused by delayed reporting of results, potentially due to a lack of time requirement for reporting results and/or a lack of tracking these results.  A possible solution to delayed reporting of results can be to implement a standardized process for reporting results, which may include time limits or guidelines for reporting results.

Incorrect treatment – whether that is not getting needed treatment or receiving unneeded treatment – can result from an incorrect diagnosis.  An incorrect diagnosis can result from  an incorrect assessment of diagnostic testing.  An incorrect assessment can result from either an incorrect interpretation of laboratory test data or incorrect data from the lab testing.

Incorrect interpretation of lab testing can result from reports that are difficult to interpret, either due to a confusing layout or illegibility.  A solution to this is to have a standardized reporting form.   Other potential causes of incorrect interpretation include confusion of verbal reporting (such as over the phone) or results not being interpreted by a specialist.  Solutions that can reduce this confusion include providing reports electronically when available or repeating results when provided verbally, and making lab experts available for interpretation.

Three main reasons that incorrect data is provided as a result of lab testing is that the specimen is associated with the wrong person, possibly because a patient is misidentified, a specimen is mislabeled, or information is entered incorrectly into the computer.  Possible solutions are to use two patient identifiers and label the specimen in the presence of the patient.

Contaminated specimens can also cause incorrect testing results.  Specimens can be contaminated at collection, handling, or testing.  Any of these issues can be caused by insufficient quality control.  The risk of contamination can be minimized by a standardized quality control procedure.

Lastly, incorrect diagnostic data can result from the wrong test being performed.   This could occur due to equipment failure, an incorrect entry into the computer, or the wrong test being ordered.  More details about any specific incident can be added to the Cause Map based on evidence gathered in the course of an investigation.

To view the Outline and Cause Map, please click “Download PDF” above.  Or click here to read more.