Use of Contraindicated Clip Leads to Death of Kidney Donor

By ThinkReliability Staff

In 2011, a kidney donor in Texas bled to death after her renal artery became open.  Sadly, her death was associated with the use of clips to close the artery – rather than staples – even though the use of clips was contraindicated for this purpose.  The instructions that came with the clips said this, as did several warning letters sent from the manufacturer in previous years.

We can look at this tragic issue in a Cause Map, or visual root cause analysis.  We begin with the impacted goals.  Because of the patient death, the patient safety goal is impacted.  Emotional impacts from employees resulting from a patient death can be considered an effect to the employee impact goal.  The use of a device other than intended is a result to the patient services goal and is considered a “never event” (an event which should never happen), resulting in an impact to the compliance goal.  A lawsuit resulting from the patient death is an impact to   the organization goal.  A total of four kidney donors are known to have died as a result of using these clips.

We begin with the impacted goals and ask “Why” questions to understand the cause-and-effect relationships resulting in this tragedy.  The patient died from a massive, sudden bleed caused by the bleeding of the renal artery which was open.  The renal artery had been opened as part of the kidney donor surgery, and had been closed using clips that slid off the renal artery.  The stump remaining on the renal artery after this kind of surgery is too short to allow the clips adequate purchase, and the clips slid off.  The hospital staff was unaware that these clips were contraindicated for this use.  Although a warning was placed on the instructions for the clips, these instructions were not kept in the operating room.  Additionally, the manufacturer sent out several letters to hospitals warning them not to use these clips for kidney surgery.  However, at that time, this hospital was not using the clips, and had forgotten about the letters when the clips were purchased.

Once the causes related to the issue have been captured, possible solutions can be brainstormed.  In this case, there are solutions for all the stakeholders in the event.  The operating team should use staples instead of these clips to close the renal artery.  The FDA has issued a safety notification to attempt to provide additional warnings against using these clips after kidney donation.  The hospital has implemented a system to track and document warnings and recalls related to medical equipment.  Some personnel in the medical community have requested that the warning not to use the clips after kidney surgery are printed directly on the clips, rather than on the operating instructions.  Dr. Amy Friedman, the Director of Transplant Services at Upstate Medical University in New York, who had raised concerns about using clips in kidney donors starting in 2004, would also like the warnings to include information that donors have died as a result of using these clips.  Although the FDA believes that the warnings up to this point have been sufficient, hopefully the additional actions will prevent another death from the use of these clips.

To view the Outline, Cause Map, and Solutions, please click “Download PDF” above.  Or click here to read more.

Abuse of “Good Grade” Pills

By Kim Smiley

A recent New York Times article, “Risky Rise of the Good-Grade Pill” talked about the dangers associated with abuse of prescription stimulants.  These stimulants are prescribed to treat attention deficit hyperactivity disorder (ADHD), but they cause individuals without the disorder to become hyper focused and better able to concentrate for long periods of time.  There isn’t good data on how many high school students are abusing the stimulants, but anecdotal evidence implies that a significant number of students, especially those at highly competitive high schools, use the prescription stimulants to help improve test score and grades.

This issue can be analyzed by building a Cause Map, a visual root cause analysis.  The first step when beginning a Cause Map is to determine the impact to the overall organizational goals.  In this example, the Safety Goal is impacted because there are risks to the students abusing the prescription stimulants.  Once the impact is defined, “why” questions are asked and causes are added to the Cause Map.

Why are there risks to students abusing prescription stimulants?  Students are at risk because students without medical need are using the stimulants, the stimulants can be dangerous and illegal sale or procession of these drugs can have severe consequences.

Students are using the stimulants because they are available and they can aid in earning good grades.  The stimulants are available because some people sell them and there is anecdotal evidence that some students fake the symptoms to get prescriptions for them.

Many of the students using these stimulants don’t realize that there can be serious health issues with using them.  First off, these drugs are one of the most addictive substances that have a medical use.  There is little known about the potential long term health issues of abusing prescription stimulants.  There is also a concern that these drugs may act as a gateway drug which has the potential to open the door to more drug abuse as students get more comfortable with the idea of taking pills. In the short term, there are a number of health issues to consider including heart irregularities, exhaustion and even psychosis during withdrawal.

Another important fact many students are unaware of is that giving these drugs to a friend can have heavy legal consequences.  Distribution of prescription stimulants is considered a felony.  Adderall, Ritalin and other name brand stimulants used to treat ADHD are controlled as Class 2 substances, the same as cocaine and morphine, and the sale of them carries severe penalties.

This issue is just beginning to come to light and more information is needed to fully understand how many students are involved and the best way to stop the abuse of the prescription stimulants.  As more information is available it can easily be added to the Cause Map.

To view a high level Cause Map of this issue, click on “Download PDF” above.

Four Patients Contracted Hepatitis C

By Kim Smiley

A cardiac catheterization lab was temporarily shutdown after four patients tested positive for hepatitis C.  All four patients have the same strain of hepatitis C which means they contracted the virus from the same source.  The investigation into this incident is ongoing, but no other connection other than the cardiac lab has been found between the four patients.

This issue can be analyzed by building a Cause Map, an intuitive root cause analysis that visually lays out the cause-and-effect relationships between the factors that contribute to an incident. The first step in building a Cause Map is to determine the impact to the overall organizational goals.  The basic information about an incident and the impacts to the goals are documented in an Outline.  In this example, the safety goal was impacted because four patients contracted hepatitis C and there is potential that more people were also infected.  The customer service goal is also impacted because hundreds of people need to be tested to ensure that they are not also infected.  Once the impact to the goals are determined, “why” questions are asked to find the causes that belong on the Cause Map.

Testing is necessarily because hepatitis C is often asymptomatic for many years so many infected individuals will not know unless they are tested.  Hepatitis C can be treated with medication and cured in 50–80% of cases, but there cases that cause severe liver issues. Hepatitis C is the leading cause of liver transplants.

651 patients had used the cardiac catheterization lab since August 2011 and all are being tested along with 30 staff members.  Test results take up to 10 days to process so the final results on how many people were infected aren’t available yet.

New Hampshire Division of Public Health and hospital officials are still investigating to determine the source of the hepatitis C.  It was likely medical equipment of some type since hepatitis C is spread through blood to blood contact.  Once the investigation is complete, any additional information can be easily added to the Cause Map so that it documents all relevant information for the issue.

Once the investigation is completed, the lab will be able to make whatever changes are necessary to ensure that all equipment is properly sterilized and this type of event doesn’t occur again.

Study Finds that Diabetics are at Risk of Medication Errors

By Kim Smiley

A new study found that nearly a third of diabetic hospital patients experienced a medication error in a one week period.  The study examined bedside data for 12,800 patients and 6,600 patient questionnaires for hospitals in England and Wales.  Medication errors when treating diabetics can have severe consequences because many diabetics require medication to maintain healthy blood sugar levels.  Blood sugar levels that are either too high or too low can result in significant illness and even death if untreated.

The two most common errors found by the study were failing to properly adjust medication when a patient’s blood sugar level was high (23.9%) and failing to sign off on the patient’s bedside information chart when insulin was given (11.1%).

This issue can be examined by building a Cause Map, an intuitive, visual root cause analysis format.  The first step to building a Cause Map is to determine the impact to the overall organizational goals.  In this example, the risk to diabetic patients is an impact to the safety goal.  The next step is to ask “why” questions and add the cause boxes to the Cause Map to illustrate the cause and effect relationships between all the factors that contributed to the issue.

In this example, the risk to the diabetic patients occurred because medication errors occurred and the patients required medication to maintain healthy blood sugar levels.  The study did not provide details on why the medication errors were made by hospital staff, but that information could be added to the Cause Map if it becomes known.  A Cause Map can be still be useful when only a high level map can be built because it can help identify an at risk population and a common problem, the diabetic patients and the medication errors, which could help identify where more research is needed or where resources could be directed.  To view a high level Cause Map of this issue, click on “Download PDF” above.

A potential solution that has been suggested for this problem is to improve training for hospital staff on how to properly treat diabetic patients.  A more detailed look at understanding exactly why the staff is making errors could help direct the training plan to the most needed areas.

More Children are Swallowing Batteries

By Kim Smiley

A new study has found that the number of children going to the emergency room because of batteries that have been swallowed or placed in the mouth, ears or nose has nearly doubled during the past 20 years.  The study determined that a child visits an emergency room in the United States every three hours for issues involving a battery.  Most of the cases involve children under 5 and batteries that were swallowed.

These findings are relevant because a swallowed battery can result in severe injury and even death in extreme cases.  This issue can be examined by building a Cause Map, a visual format for performing a root cause analysis.  In this example, there is the potential for serious injury or death because children are swallowing batteries and batteries can cause serious injuries. More children are swallowing batteries in part because of the increasing popularity of button batteries, which account for 84% of all battery-related ingestions.  Button batteries are shiny, circle batteries that are used in a number of modern gadgets and there are far more of them in the typical house today than 20 years ago.  They are used to power toys, games, hearing aids, remotes and any number of small things common in the modern household.

Button batteries are more likely to be swallowed than traditional batteries because they are much smaller.  It’s also easy to see how the shiny appearance of button batteries would be tempting to small children.  Some devices use screws or other restraints on their battery compartments so that children can’t remove the batteries, but many devices do not, especially those intended for adult use.

Button batteries can cause serious injuries because they can get stuck in the esophagus, a moist environment where the battery can form a microcell that erodes the tissue.  In the worst cases, the battery can eat though the throat and into the aorta, causing a child to bled to death.  Damage can also occur very quickly, in less than two hours and the child may not show any symptoms at first.

The best way to protect children is to tape the battery compartment or securely store all devices that use button batteries if the battery compartment does not have a screw.  It is also essential to take children to the emergency room immediately if there is any suspicion that they might have swallowed a battery.  A simple x-ray can determine if a battery was swallowed and quick removal of the battery can prevent significant damage if the battery is caught in their esophagus.

Click “Download PDF” above to view a high level Cause Map of this issue.

Amish have few allergies

By Kim Smiley

A new study has found that Amish children living in Indiana have far fewer allergies than the general population and even significantly fewer allergies than other children living on farms.  As high as 50 percent of the general population has evidence of allergic sensitivity when tested and only seven percent of the Amish children had allergic sensitivity.  The study also looked at Swiss children living on farms and found that they had half the allergic sensitivity of the general population, but still more than Amish children.

Why is this finding significant?  Scientists hope that studying the Amish will help them understand what factors are causing the large increase in allergies in the general population in Western Countries over the past few decades.

This issue can be built into a Cause Map, an intuitive, visual root cause analysis, to help illustrate the-cause-and-effect relationship between the factors involved.  As more research is done and more information on this issue becomes available, it can easily be added to the Cause Map.  In this example, researchers aren’t sure why the Amish have such low levels of allergic sensitivities, but there are a few factors that are likely involved.  These factors could be documented on the Cause Map, but a question mark would be added to note that more information is needed to verify the accuracy of the cause and to ensure proper placement on the Cause Map.  To view a high level Cause Map of this issue, click “Download PDF” above.

One fact worth adding to the Cause Map is that Amish are exposed to a wide variety of animals and the germs that go along with them from a young age. Many Amish live on farms and nearly all own horses for transportation.  Additionally, Amish children help care for the animals from a young age.  Pregnant Amish women are also typically around large animals and the prenatal exposure may play a role.  Many Amish also consume unpasteurized milk and the impact of this on development of allergies is an ongoing debate.

In addition to environmental factors, some researchers also think that genetic plays a role in allergies so it is also worth noting that the Amish are relatively isolated genetically with limited mixing with the general population.

Understanding the factors that contribute to the low allergy rates of Amish children would hopefully help scientists both understand why allergies in the general population are increasing so dramatically and the best actions to take to treat them, maybe even before they develop.

A Blood Test for Depression?

By Kim Smiley

A new study has determined that it may be possible to develop a blood test to diagnose depression in teens.  Finding better ways to treat depressed teens is important because untreated depressed teens are at higher risk for substance abuse, social difficulties, physical illness and suicide. Teens are particularly at risk from depression because this is an age when depression frequently hits and teens can be difficult to properly diagnose and treat.

Currently, the process to diagnose depression is subjective and relies on a patient’s ability to identify and describe symptoms, something that is typically more difficult for teens.  Depressed teens are even more likely to struggle with steps needed to receive treatment for depressions.  Teens are also typically more worried about others opinions than adults and the fear of judgment from their peers may prevent depressed teens from seeking treatment.

An objective blood test would help simplify the process of diagnosing teens with depression and should help more depressed teens receive appropriate treatment.  A straight forward test, like a test for blood sugar or for cholesterol, should also help remove any remaining social stigma of depression treatment so hopefully more affected individuals would seek treatment.

In this study, experimental blood tests were done looking for genetic markers that had been identified in earlier studies using rats.  Eleven genetic markers were found that were tied to depression. The researchers were also able to identify which participants had major depression and which suffered from major depression with anxiety.  The hope is that a blood test could eventually be used not only to diagnosis depression, but also to differentiate between subtypes of depression, information that would certainly be useful when determining the best course of treatment for patients.

Significantly more work is needed to develop an effective blood test, but this early study hints that it could be possible to create an objective test for depression.  This study used a limited number of subjects, 28 teens between 15 and 19 years old, so larger studies will be needed in the future.

This issue can be analyzed by building a Cause Map, a visual root cause analysis.  To view the Cause Map, click on “Download PDF” above.

Airman Loses Both Legs After Gallbladder Surgery

By ThinkReliability Staff

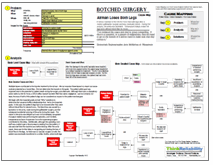
A former member of the US Air Force lost both legs after a routine gallbladder surgery and was medically retired.  During the surgery, his aorta was lacerated.  Subsequent delays meant his legs were without blood flow for hours.

After the damage to the aortic laceration was repaired, still more time passed before the patient was transferred to a civilian hospital for treatment.  The Air Force Medical Center did not have a vascular surgeon on-site.  By the time the legs were removed, the patient had lost more than 2/3 of his blood volume.

Multiple issues contributed to the injuries received by the airman.  We can examine these issues in a visual root cause analysis presented as a Cause Map.  First we determine the impacts to the goals.  The patient safety goal was impacted due to the potential for patient death during the surgery and aftermath.  Although there was no disciplinary action taken by the Air Force, a $54.8 million lawsuit has been filed that claims negligence.  Last but certainly not least, the loss of both of the patient’s legs can be considered an impact to the patient services goal.

We begin with the impacted goals and ask “Why” questions to determine the cause-and-effect relationships that led to the impacted goals.  In this case, the patient’s legs had to be removed after they were without blood flow for several hours.  The blood loss was caused by a laceration to the aorta, made during the gallbladder surgery, and the subsequent accidental suturing of the aorta during the repair.  The repair to the aorta was delayed as it was not immediately recognized.  A surgical resident was performing the operation, and it is likely inexperience and lack of supervisor from the supervising surgeon contributed to this delay.  Additionally, although the operating room staff was unable to get a blood pressure reading from the patient, it was assumed that the machine was malfunctioning. After the aorta repair, there was further delay in recognizing and treating the loss of blood flow to the legs.  As there was no vascular surgeon on-site, the patient was eventually transferred to a civilian facility, where both legs were amputated.

The facility has not commented on the case and so it is unclear what actions might be taken to protect patients.  There have been several charges of negligence at the facility in recent years.

To view the Outline and Cause Map, please click “Download PDF” above.  Or click here to read more.

Theft at Healthcare Facilities Puts Patient Data at Risk

By ThinkReliability Staff

There have been many reported cases of thefts at healthcare facilities that resulted in patient data being at risk.  Loss of medical equipment or patient safety data is a big issue for the involved healthcare facility, and it’s all too common.  More than half of healthcare facilities have reported at least one health data breach since 2009.  It is   estimated that 66% of reported breaches are due to theft.  (For an example of a patient privacy breach not related to theft, read our previous blog.)

Some notable thefts: more than $1 million worth of equipment (including some that contained patient information) was stolen over a two-year period from a VA Hospital in Florida.  A health insurance provider lost nine server drives, including patient and provider information  for 1.9 million people.  The theft was not reported until two months later and followed a theft two years prior of a portable disk drive which contained personal data for 1.5 million members.  We can look at the issue of theft of equipment in a proactive root cause analysis performed as a Cause Map, which allows us to visually map causes that could results in impacts to the goals.

In this case, there is the risk of impact to the patient safety goal if patient medical records are impacted.  The loss of property can be considered an impact to employees, the organization, and the property goal.  The loss of patient data can be considered an impact to the patient services and compliance goal (as compliance with privacy regulations may be affected).  In this case, we look specifically at loss of equipment and data due to theft.

Beginning with the impacted goals, we can ask “Why” questions to add detail to the Cause Map.  Loss of property can result from theft, and insufficient inventory records can contribute.  (This was noted in the case of the VA loss.)  Theft can occur within or outside a healthcare facility.   Within a facility, property can be stolen by either employees, or non-employees.  If it is determined that property was only accessed by employees, more intense background checks may be in order.  In either case, security needs to be considered.  The levels of security depend on the type of facility, type of property and data contained in various spaces, and various other factors, and should be considered for each facility individually.

Property that is stolen outside the facility is generally stolen from an employee who works off-site or has taken data off-site, and insufficiently protects the data.  If employees are allowed to have sensitive information or expensive equipment off-site, sufficient precautions must be taken, which are also dependent on the sensitivity of data, value of property, and needs of the facility.

To view the Outline and Cause Map, please click “Download PDF” above.

New Research on the Impact of Hospital-Acquired Infections

By ThinkReliability Staff

Recent research has shown that in-hospital mortality for patients who acquire an infection in the hospital increases from 4.5% to 18.5%.  Hospital-acquired infections are infections obtained while a patient is hospitalized.  The three main hospital-acquired infections (or HAIs) are bloodstream infections (28% of HAIs), pneumonia (21%) and urinary tract infections (15%).

Not only does an HAI increase the mortality rate, it has other impacts as well.  We can look at these impacts, and their causes, in a root cause analysis demonstrated visually as a Cause Map.  For the purpose of this root cause analysis, we will limit our investigation to HAIs that occur during hospitalization in an intensive care unit (ICU).  We begin with determining the other impacts to the goals.  The patient safety goal is impacted due to the increase in mortality.  The organization goal is impacted because many insurers (including Medicare and Medicaid) will not reimburse for some infections obtained during hospitalization.   Additional treatment is required to treat the infection, resulting in an impact to the patient services goal.  The treatment for these infections normally results in an increased stay in the ICU (from an average of 8.1 days to 15.8 days), at a cost of $16,000.  It is estimated that 26.7% of all ICU stays result in at least one HAI.

Beginning with the impacted patient safety goal, we can ask “Why” questions to demonstrate the cause-and-effect relationships leading to the increase in mortality.  Increased mortality is due to the acquiring of an HAI.  HAIs result from the exposure to a pathogen and frequently occur in the ICU partially due to the increased risk of infection due to the underlying condition for which the patient is in the ICU.  There are two types of pathogens to which patients can be exposed: endogenous (essentially, from the patient’s own body) and exogenous (from visitors, healthcare providers, equipment, the environment, etc).  HAIs are highly related to the use of invasive support measures, which provide a path for either kind of pathogen directly into the patient’s body.  Specifically, the use of a central intravenous line is cited in 91% of bloodstream infections, mechanical ventilation is cited in 95% of hospital-acquired pneumonias, and urinary catheters are cited in 77% of urinary tract infection.

Because these invasive support measures are generally required for patient care, it’s difficult to see how these infections can be reduced.  However, some programs have been shown to substantially reduce HAIs – and the cost associated with them – by improving the culture of safety and compliance with preventive methods.  One such program in Michigan has reduced the rate of bloodstream infections associated with central lines from 7.7 to 1.3 per 1,000 catheter days.  Even without a dedicated safety program, insisting on hand washing and proper cleanliness procedures during the insertion, checking, and removal of invasive support measures can reduce the risk of HAIs.  Additionally, because the use of invasive support measures is so strongly correlated to HAIs, removal of these measures as soon as possible can also reduce the risk.

To view the Outline and Cause Map, please click “Download PDF” above.  Click here to read more about hospital-acquired conditions.  Or click here to read more about the latest research.