Tag Archives: healthcare

Successful Emergency Response to Boston Bombing

By ThinkReliability Staff

The successful activation of emergency plans allowed 8 hospitals in the Boston area to treat 144 trauma patients injured in the bombings that occurred April 15, 2013 near the finish line of the Boston Marathon.  Even with that heavy burden, these hospitals ensured the continued safety of patients and staff during a very unsure time, as well as assisting the police and Federal Bureau of Investigation (FBI) with the ongoing investigation.

While details on the bombings themselves are still being determined and disseminated, it’s apparent that emergency planning and preparedness processes within the area Boston hospitals were successful in allowing an ‘unprecedented’ response.  We can view the response to the bombings by the area hospitals in what we like to call a root cause “success” analysis.  After all, lessons can be learned not only from what didn’t go well, but also what did.  Hospitals around the country can learn from the response by the Boston area hospitals to this trauma.

When Massachusetts General asked hospital staff from Israel, who unfortunately see this kind of trauma on a far more regular basis, to give emergency response training they likely did not suspect their hospital to be the site of a horrific mass trauma like that experienced in Boston.  The hospital’s experience with war-style trauma was certainly extremely helpful in dealing with the aftermath of this kind of trauma, rarely seen outside of war zones.  As Dr. Ron Walls, the chairman of the Department of Emergency Medicine at Brigham and Women’s Hospital stated, “For many, many people in emergency medicine who are practicing domestically and not in the military, these are once-in-a-lifetime events.”

For once-in-a-lifetime events, facilities have to hope that the training and education they’ve provided to their staff, and the processes that they’ve developed for dealing with emergencies, can stand up to the tragedy.  In this case, these Boston hospitals (once they have time to take a breath, which may not be for a while), should give themselves a pat on the back for their amazing handling of a tragic event.  Hospitals elsewhere should take note and ensure that their emergency procedures will allow the same sort of successful response.

A pat on the back should also go out to the staff in the medical tent at the finish line, whose quick actions and extensive equipment allowed on-scene stabilization and quick transfer of the severely injured to the area hospitals.  Lastly, the many spectators who kept their cool and assisted on scene should also be commended.

To view the Outline and Cause Map, please click “Download PDF” above.  Or click here to learn more about the emergency procedures at Massachusetts General.

Is the NFL Getting More Dangerous?

By Kim Smiley

Player injuries in the National Football League (NFL) have been making headlines for years now.  One of the questions that have been asked is whether increases in players’ weight and speed have been making the game more dangerous.

A Cause Map, an intuitive method for performing a root cause analysis, can be used to analyze this issue.  The first step when building a Cause Map is to determine how the overall goals are impacted.  In this example, the main focus will be player safety, but there are factors worth considering such as the negative publicity this issue has generated for the NFL.  There is also a whole lot of money in play with a lawsuit that more than 4000 players have filed against the NFL for allegedly covering up life-altering brain injuries.

The Cause Map is built by taking one of the impacted goals and asking “why” questions.  Why is there a safety concern?  There is the potential for severe neurological trauma because players are suffering brain injuries on the field.  The obvious reason this happens is because it’s football.  Players are hit and hit hard as part of perfectly legal and allowed tackles.  It’s how the game is played.    Players may also be hurt during illegal plays, such as a helmet-to-helmet contact, which are more likely to cause brain damage.  One extremely hard hit can end a career, but more and more evidence is showing that milder, repeated hits may also cause life-altering brain injuries.  Another potential cause that might be worth exploring is the protection that players wear.  They are still getting hurt despite wearing helmets and pads.  Maybe different equipment could help prevent some of these injuries.

The protective gear has improved and the tackling rules have been modified, but the basic game has remained the same since 1920 when the NFL began with one notable expectation.  The players themselves have changed radically over the decades.  In the 1920, the average lineman was 190 pounds.  The average lineman these days weighs 300 pounds.  Despite the extra 100 plus pounds, the average lineman has also gotten faster.  A faster, heavier player hits with more force and slamming into another body with more force probably isn’t healthier for anybody involved.

Continuing the Cause Map, it makes sense to ask why today’s players are so much bigger and quicker.  Specialization of training and nutrition programs surely play a role in the evolution of the player’s body.  There is also speculation that performance enhancing drugs are being used and complaints about the lack of the effective testing for substances such as human growth hormone.

This is an issue that still needs research.  A better understanding of how impacts are affecting brains is needed so that the full scope of the issue is known.  If the problem is as large as it is suspected, better ways of protecting these players need to be found.

Manifestation of Poor Glycemic Control Part 1

By ThinkReliability Staff

Nonketotic hyperosmolar coma resulting from poor glycemic control within a hospital setting is now considered a hospital-acquired condition by Medicare & Medicaid, meaning that hospitals will not receive additional  payment for cases when this condition is acquired during hospitalization.  Because of the severity of the impact of this condition, its implications and causes should be carefully studied to determine ways to reduce the risk of this condition being acquired during a hospital stay.

We can look at the impacted goals for a hospital and the potential causes for this condition, in a visual root cause analysis or Cause Map.  To perform a Cause Mapping analysis, we will first determine the impacts of a given condition on an organization’s goals, then develop cause-and-effect relationships to diagram the causes that result in the condition.

According to a study published in the International Journal for Quality in Health Care, diabetic emergencies, including nonketotic hyperosmolar coma,  increases the risk of patient death (from 9% to 16%),  length of patient stay (from 7 to 14 days) and treatment requirements.  The costs associated with nonketotic hyperosmolar coma (greater than $114 million in the US in 2007, according to CMS) are no longer reimbursable when the condition is acquired in the hospital.  Additionally, patient death due to hospital-acquired conditions can result in a second victim – the healthcare provider(s).

To analyze this issue, we begin with an impacted goal and ask “Why” questions.  In this case, we are looking at the impact to the patient safety goal becaue of the  increased risk of patient death due to nonketotic hyperosmolar coma, which is caused by uncontrolled hyperglycemia (high blood glucose).   Associated infection, medication that interferes with glucose absorption, and insulin deficiency can all contribute to hyperglycemia.  Insufficient knowledge of providers about glycemic control can result in diabetic patients being given medications that interfere with glucose absorption, or in inadequate control of diabetes with insulin in the hospital setting.

The study referenced above also found that insufficient staffing, which may result in insufficient backups/checks of staff, use of workarounds, and ineffective communication between the team, leading to insufficient tracking of glycemic control.    Providers may also be unaware of a patient’s diabetic status, due to poor record keeping or communication.   Inadequate insulin therapy can also contribute to hyperglycemia.  Specifically, medication errors involving insulin (see our medication error Cause Map), fear of hypoglycemia (which may result in fear of aggressive insulin therapy), and  failure to adjust insulin for diet or other factors, including age, renal failure, liver disease, can result in an all too common “one size fits all” linear sliding insulin scale providing inadequate results.

Two other conditions are considered hospital-acquired manifestations of poor glycemic control, diabetic ketoacidosis and hypoglycemic coma.  In future blogs, we will discuss the causes of these issues, and suggested solutions to reduce the risk of these types of incidents.

To view the Outline and Cause Map, please click “Download PDF” above.  Or click here to read more.

At Least 31 Patients Contracted Hepatitis C

by Kim Smiley

Testing is still ongoing, but at least 31 people have contracted hepatitis C from contaminated syringes at a New Hampshire cardiac catheterization lab.  A previous blog discussed the outbreak when it was initially announced that four patients who had used the same cardiac catheterization lab had tested positive for the same strain of hepatitis C, but more information has been released and the Cause Map should be updated to incorporate all the relevant details.  One of the strengths of a Cause Map, a visual root cause analysis, is that it can be updated relatively quickly to document important information as it becomes available.  In this example, investigators are continuing to work to understand the issues involved, but two new significant pieces of information should be added to the Cause Map.

The source of the hepatitis C has been determined by investigators.  Investigators found that a medical technician with hepatitis C contaminated syringes that were then used on patients.  The medical technician is a drug addict who used the syringes because they were filled with Fentanyl, an anesthetic far more powerful than morphine.  Hepatitis C is spread through blood to blood contact so syringes contained with hepatitis C are a major health hazard that are capable of spreading the disease. The syringes were not secured so he was able to attain them.  He then used them, refilled them with saline or another liquid and replaced them without any other member of the staff noticing.

Investigators have also learned that the medical technician responsible for the contamination has worked in 18 hospitals in seven other states during the last 10 years.  It’s not known when the medical technician contracted hepatitis C, but investigators believe he had a positive test for hepatitis C in June 2010.  This means that the investigation needs to be expanded and that many more people may need to be tested.

This article contains information about what facilities the medical technician worked at and the timeline for his employment.  To view an updated high level “Cause Map”, click here.

Medical Laboratory Errors

By ThinkReliability Staff

Surprisingly, many of what are considered laboratory errors do not actually occur in the lab.  But errors related to laboratory testing can negatively impact patient care.  We can look at the impacts and causes of errors related to diagnostic testing in a Cause Map, which allows us to visually diagram cause-and-effect relationships.

We begin this type of root cause analysis by determining the impacts to the organization’s goals.  In this case, because we want to consider all possible sources of diagnostic errors in a proactive analysis, we will look at the generic goals for an organization that provides healthcare.  Diagnostic errors can cause an impact to the patient safety goal because of the risk of impact to patient treatment.  Employees’ abilities to do their job is impacted because they may be receiving incorrect information from lab testing. There is a risk of impact to the patient’s treatment, which is an impact to the patient services goal.  Additionally, there is a risk of performing unnecessary treatment as a result of incorrect testing results, which could impact both the property and labor goals.

Once we have determined the impacts to the organization’s goals (and there may be more impacts for specific incidents involving diagnostic testing errors), we can ask “Why” questions to determine the causes that result in these impacts.  We will begin with the patient safety goal impact.  The patient safety goal is impacted because of the risk of an impact to a patient’s treatment.  This includes the possibilities of a risk of delayed treatment, risk of not receiving needed treatment, and a risk of unnecessary treatment.  Delayed treatment can occur from a delayed diagnosis, which could result from either delayed or incorrect testing results.

Delay of testing results can be caused by delayed reporting of results, potentially due to a lack of time requirement for reporting results and/or a lack of tracking these results.  A possible solution to delayed reporting of results can be to implement a standardized process for reporting results, which may include time limits or guidelines for reporting results.

Incorrect treatment – whether that is not getting needed treatment or receiving unneeded treatment – can result from an incorrect diagnosis.  An incorrect diagnosis can result from  an incorrect assessment of diagnostic testing.  An incorrect assessment can result from either an incorrect interpretation of laboratory test data or incorrect data from the lab testing.

Incorrect interpretation of lab testing can result from reports that are difficult to interpret, either due to a confusing layout or illegibility.  A solution to this is to have a standardized reporting form.   Other potential causes of incorrect interpretation include confusion of verbal reporting (such as over the phone) or results not being interpreted by a specialist.  Solutions that can reduce this confusion include providing reports electronically when available or repeating results when provided verbally, and making lab experts available for interpretation.

Three main reasons that incorrect data is provided as a result of lab testing is that the specimen is associated with the wrong person, possibly because a patient is misidentified, a specimen is mislabeled, or information is entered incorrectly into the computer.  Possible solutions are to use two patient identifiers and label the specimen in the presence of the patient.

Contaminated specimens can also cause incorrect testing results.  Specimens can be contaminated at collection, handling, or testing.  Any of these issues can be caused by insufficient quality control.  The risk of contamination can be minimized by a standardized quality control procedure.

Lastly, incorrect diagnostic data can result from the wrong test being performed.   This could occur due to equipment failure, an incorrect entry into the computer, or the wrong test being ordered.  More details about any specific incident can be added to the Cause Map based on evidence gathered in the course of an investigation.

To view the Outline and Cause Map, please click “Download PDF” above.  Or click here to read more.

Use of Contraindicated Clip Leads to Death of Kidney Donor

By ThinkReliability Staff

In 2011, a kidney donor in Texas bled to death after her renal artery became open.  Sadly, her death was associated with the use of clips to close the artery – rather than staples – even though the use of clips was contraindicated for this purpose.  The instructions that came with the clips said this, as did several warning letters sent from the manufacturer in previous years.

We can look at this tragic issue in a Cause Map, or visual root cause analysis.  We begin with the impacted goals.  Because of the patient death, the patient safety goal is impacted.  Emotional impacts from employees resulting from a patient death can be considered an effect to the employee impact goal.  The use of a device other than intended is a result to the patient services goal and is considered a “never event” (an event which should never happen), resulting in an impact to the compliance goal.  A lawsuit resulting from the patient death is an impact to   the organization goal.  A total of four kidney donors are known to have died as a result of using these clips.

We begin with the impacted goals and ask “Why” questions to understand the cause-and-effect relationships resulting in this tragedy.  The patient died from a massive, sudden bleed caused by the bleeding of the renal artery which was open.  The renal artery had been opened as part of the kidney donor surgery, and had been closed using clips that slid off the renal artery.  The stump remaining on the renal artery after this kind of surgery is too short to allow the clips adequate purchase, and the clips slid off.  The hospital staff was unaware that these clips were contraindicated for this use.  Although a warning was placed on the instructions for the clips, these instructions were not kept in the operating room.  Additionally, the manufacturer sent out several letters to hospitals warning them not to use these clips for kidney surgery.  However, at that time, this hospital was not using the clips, and had forgotten about the letters when the clips were purchased.

Once the causes related to the issue have been captured, possible solutions can be brainstormed.  In this case, there are solutions for all the stakeholders in the event.  The operating team should use staples instead of these clips to close the renal artery.  The FDA has issued a safety notification to attempt to provide additional warnings against using these clips after kidney donation.  The hospital has implemented a system to track and document warnings and recalls related to medical equipment.  Some personnel in the medical community have requested that the warning not to use the clips after kidney surgery are printed directly on the clips, rather than on the operating instructions.  Dr. Amy Friedman, the Director of Transplant Services at Upstate Medical University in New York, who had raised concerns about using clips in kidney donors starting in 2004, would also like the warnings to include information that donors have died as a result of using these clips.  Although the FDA believes that the warnings up to this point have been sufficient, hopefully the additional actions will prevent another death from the use of these clips.

To view the Outline, Cause Map, and Solutions, please click “Download PDF” above.  Or click here to read more.

Theft at Healthcare Facilities Puts Patient Data at Risk

By ThinkReliability Staff

There have been many reported cases of thefts at healthcare facilities that resulted in patient data being at risk.  Loss of medical equipment or patient safety data is a big issue for the involved healthcare facility, and it’s all too common.  More than half of healthcare facilities have reported at least one health data breach since 2009.  It is   estimated that 66% of reported breaches are due to theft.  (For an example of a patient privacy breach not related to theft, read our previous blog.)

Some notable thefts: more than $1 million worth of equipment (including some that contained patient information) was stolen over a two-year period from a VA Hospital in Florida.  A health insurance provider lost nine server drives, including patient and provider information  for 1.9 million people.  The theft was not reported until two months later and followed a theft two years prior of a portable disk drive which contained personal data for 1.5 million members.  We can look at the issue of theft of equipment in a proactive root cause analysis performed as a Cause Map, which allows us to visually map causes that could results in impacts to the goals.

In this case, there is the risk of impact to the patient safety goal if patient medical records are impacted.  The loss of property can be considered an impact to employees, the organization, and the property goal.  The loss of patient data can be considered an impact to the patient services and compliance goal (as compliance with privacy regulations may be affected).  In this case, we look specifically at loss of equipment and data due to theft.

Beginning with the impacted goals, we can ask “Why” questions to add detail to the Cause Map.  Loss of property can result from theft, and insufficient inventory records can contribute.  (This was noted in the case of the VA loss.)  Theft can occur within or outside a healthcare facility.   Within a facility, property can be stolen by either employees, or non-employees.  If it is determined that property was only accessed by employees, more intense background checks may be in order.  In either case, security needs to be considered.  The levels of security depend on the type of facility, type of property and data contained in various spaces, and various other factors, and should be considered for each facility individually.

Property that is stolen outside the facility is generally stolen from an employee who works off-site or has taken data off-site, and insufficiently protects the data.  If employees are allowed to have sensitive information or expensive equipment off-site, sufficient precautions must be taken, which are also dependent on the sensitivity of data, value of property, and needs of the facility.

To view the Outline and Cause Map, please click “Download PDF” above.

New Research on the Impact of Hospital-Acquired Infections

By ThinkReliability Staff

Recent research has shown that in-hospital mortality for patients who acquire an infection in the hospital increases from 4.5% to 18.5%.  Hospital-acquired infections are infections obtained while a patient is hospitalized.  The three main hospital-acquired infections (or HAIs) are bloodstream infections (28% of HAIs), pneumonia (21%) and urinary tract infections (15%).

Not only does an HAI increase the mortality rate, it has other impacts as well.  We can look at these impacts, and their causes, in a root cause analysis demonstrated visually as a Cause Map.  For the purpose of this root cause analysis, we will limit our investigation to HAIs that occur during hospitalization in an intensive care unit (ICU).  We begin with determining the other impacts to the goals.  The patient safety goal is impacted due to the increase in mortality.  The organization goal is impacted because many insurers (including Medicare and Medicaid) will not reimburse for some infections obtained during hospitalization.   Additional treatment is required to treat the infection, resulting in an impact to the patient services goal.  The treatment for these infections normally results in an increased stay in the ICU (from an average of 8.1 days to 15.8 days), at a cost of $16,000.  It is estimated that 26.7% of all ICU stays result in at least one HAI.

Beginning with the impacted patient safety goal, we can ask “Why” questions to demonstrate the cause-and-effect relationships leading to the increase in mortality.  Increased mortality is due to the acquiring of an HAI.  HAIs result from the exposure to a pathogen and frequently occur in the ICU partially due to the increased risk of infection due to the underlying condition for which the patient is in the ICU.  There are two types of pathogens to which patients can be exposed: endogenous (essentially, from the patient’s own body) and exogenous (from visitors, healthcare providers, equipment, the environment, etc).  HAIs are highly related to the use of invasive support measures, which provide a path for either kind of pathogen directly into the patient’s body.  Specifically, the use of a central intravenous line is cited in 91% of bloodstream infections, mechanical ventilation is cited in 95% of hospital-acquired pneumonias, and urinary catheters are cited in 77% of urinary tract infection.

Because these invasive support measures are generally required for patient care, it’s difficult to see how these infections can be reduced.  However, some programs have been shown to substantially reduce HAIs – and the cost associated with them – by improving the culture of safety and compliance with preventive methods.  One such program in Michigan has reduced the rate of bloodstream infections associated with central lines from 7.7 to 1.3 per 1,000 catheter days.  Even without a dedicated safety program, insisting on hand washing and proper cleanliness procedures during the insertion, checking, and removal of invasive support measures can reduce the risk of HAIs.  Additionally, because the use of invasive support measures is so strongly correlated to HAIs, removal of these measures as soon as possible can also reduce the risk.

To view the Outline and Cause Map, please click “Download PDF” above.  Click here to read more about hospital-acquired conditions.  Or click here to read more about the latest research.

Counterfeit Drugs Bought by US Oncology Practices

By Kim Smiley

Counterfeit Avastin, a cancer treatment drug, was purchased by as many as 19 U.S. oncology practices last year.  The counterfeit drug did not contain anything that would harm patients, but there were no active cancer fighting ingredients in it. There have been no reported cases of patients being given the fake drug, but there was a very real risk that this could happen.

How did this happen?  How could so many medical facilities fall for a counterfeit drug?

This example can be analyzed by building a Cause Map, a visual root cause analysis format that intuitively shows the cause-and-effect relationships between the many Causes that contribute to an issue.   In this case, many factors led to the oncology practices purchasing the fake Avastin.  The supplier offered the lowest price for the drug, about $400 less than the manufacturer’s price.  Additionally, the supplier appeared to be legitimate and had a very convincing salesman working for them.  The supplier appeared to have both US phone number and offices in the US.  In reality, the US number phones were being automatically routed to an overseas number, but this process was transparent to the medical practices.  The counterfeit drugs themselves also appeared to be authentic.  As technology improves it is becoming more difficult to spot the fakes.

At this point in the investigation it’s not clear whether the supplier knew the drugs were fakes.  The company claims it had no knowledge that the counterfeit product.  One thing that is clear is why counterfeit drugs appear in the supply.  There is a lot of money to be made. Some prescription drugs are extremely expensive and selling fakes can be very profitable.  The drug in this case, Avastin, sells for more than $2,000 for a 400-milligram vial.  There are also generally less severe punishments for crimes associated with prescription drugs compared with the illegal drug trade.

It is estimated that less than one percent of the drug supply is counterfeit in developed nations, but counterfeit drugs are a huge issue in developing countries.  Even a small amount of counterfeit prescription drugs  has the potential for a large impact on peoples’ health.  There are a number of solutions to this issue that have been suggested.  The US Senate has recently passed a bill that pushes for stronger punishments for counterfeit drug trafficking and calls for a universal system to track prescription drugs, but it’s unclear how this might be adopted into law.

To view a high level Cause Map of this issue, click “Download PDF” above.

Patient Death over the Holidays

By ThinkReliability Staff

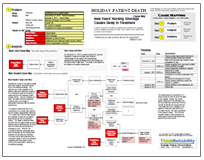
On December 31, 2010, a patient entered St. James’s Hospital in Leeds for a urinary tract infection.  Unfortunately for the patient, the hospital was experiencing nursing shortages due to the holiday and the patient died 3 days later.  The death of the patient is an impact to the patient safety goal.  We can look at this incident in more detail, based on the information available, in a root cause analysis presented in a visual Cause Map format.

Besides the impact to the patient safety goal, there was an employee impact due to the staffing shortage.  The patient’s son noted mistakes in the patient notes and charts (an impact to the compliance goal) and received a settlement from the National Health Service (NHS).  Last but certainly not least, the patient services goal was impacted due to the delay in appropriate treatment that the patient experienced.

To add more detail to the Cause Map, we can ask “why” questions.  The patient’s death was due to the combination of a urinary tract infection and the delay in appropriate treatment.  The urinary tract infection was caused by a catheter in place as the patient was bed-bound due to a previous stroke.   The delay in treatment was two-fold: first, the patient was not given another dose of antibiotics for 24 hours after the initial dose administered in the emergency room.  Second, the medication that was eventually given was not effective as the infection was resistant to that particular antibiotic.  The junior doctor who prescribed the medication failed to notice the antibiotic resistance and there was no over check of the prescription, likely due to the staffing shortage.

The patient was not monitored for 15 hours during the first 24 hours she was in the hospital.  Neither the nurses (again, likely due to the shortage) nor the consultant who performed morning rounds monitored her during this time.  This likely also led to mistakes in the patient’s notes and chart (which her son says number 140) and contributed to the patient’s death.  The NHS and hospital involved have developed an action plan to ensure that lessons are learned from this incident.

To view the Outline and Cause Map, please click “Download PDF” above.