Tag Archives: public safety

Put down the cookie dough

By ThinkReliability Staff

Almost everybody knows that there are potential risks with eating raw cookie dough (or any other raw batter).  However, much of that risk was thought to be due to the potential of salmonella from raw eggs and so, if the plan was to eat, rather than cook, the dough, the eggs could just be left out.  No more! say health experts.  Turns out that just removing the eggs and eating the raw dough may protect you from salmonella, but it still leaves you at risk for E. coli.
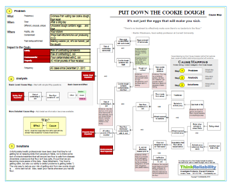
A Cause Map, or visual form of root cause analysis, can help demonstrate the risks (or potential impacts) associated with an issue, as well as the causes that lead to those risks.  The process begins by capturing the what, when and where of an incident, as well as the impact to the goals in an Outline.  In this case, the problems being addressed are risk of illness from eating raw cookie dough, as well as a recall associated with contaminated flour.  The when and where are just about everywhere that dough or batter is being made (or eaten).  The safety risks most commonly associated with eating raw cookie dough are salmonella and now E. coli.  The environmental goal is impacted because flour is contaminated with E. coli and the property goal is impacted because of 45 million pounds of flour that have been recalled by the current recall.

Once the impacted goals are captured, they become the first “effects” in the cause-and-effect relationships.  The Cause Map is created by capturing all the causes that led to an effect.  In this case, the risk of contracting salmonella from eating raw cookie dough results from eggs being exposed to salmonella, and the salmonella not being effectively destroyed (by the heat of baking).  The risk of contracting E. coli results from a similar issue.

Cookie dough contains raw flour.  The cooking process kills E. coli (as well as salmonella), meaning cookies and other baked goods are safe to eat, but dough is not.  Distributed raw (uncooked) flour was found to be contaminated with E. coli (leading to the impacted environmental goal and the recall).  The flour was likely contaminated with E. coli while it was still wheat in the field.  Birds and other animals do their business just about wherever they want, and it’s got some bacteria in it, meaning that excrement that falls on wheat fields can deliver contamination to pre-flour.  (Quick side note: we frequently get asked when to stop asking “why” questions.  When you get to an answer that is completely outside your control, like why birds poop in wheat fields, for example, this is a good place to end the cause-and-effect reasoning.)

While flour is processed, the process isn’t designed to completely kill pathogens (unlike pasteurization, for example) and according to Martin Wiedmann, food safety professor at Cornell University, “There’s no treatment to effectively make sure there’s no bacteria in the flour.”  Flour is not designed to be a ready-to-eat product.

Once the causes related to an issue have been developed, the next step is to brainstorm and select solutions.  Unfortunately, health professionals have been clear that they’re not getting far on keeping birds from pooping in fields, nor is there some sort of miracle treatment that will ensure raw flour is safe from disease.  (Scientists underscore that flour isn’t less safe, it’s just that we are becoming more aware of the risks.  Says Wiedmann, “Our food is getting safer, but also our ability to detect problems is getting better.”)  The only way to reduce your risk of getting sick from raw cookie dough is . . . not to eat it at all.  Also, wash your hands whenever you handle flour. (This is of course after you’ve thrown out the floor involved in the recall, which you can find by clicking here.)

To view the Cause Map of the problems associated with raw cookie dough, please click on “Download PDF” above.

CDC provides guidance for states to respond to Zika cases

By ThinkReliability Staff

The first Zika cases related to the current outbreak were found in Brazil in May 2015, along with a dramatic increase in microcephaly in babies born in that year. (See our previous blog about the possible link – now verified – between Zika and microcephaly.) Microcephaly is a serious birth defect that impacts many children whose mothers contract Zika while pregnant.

Active Zika transmission currently exists in nearly all of South and Central America, the Caribbean, and some Pacific Islands. 934 people in the US have been infected with Zika; 287 of those infected are pregnant women. Most of these people were infected outside the country and then traveled to the US. Zika is primarily spread by mosquitos, but can also be transmitted through blood transfusion, laboratory exposure and sexual contact.

While no cases of transmission by mosquito have yet been reported in the continental US, the Centers for Disease Control and Prevention (CDC) has released a blueprint for states to respond to locally transmitted cases of Zika. A visual diagram outlining the steps to be taken from the blueprint (a Process Map) can be helpful. (To view the Process Map for the CDC’s interim Zika response process, click on “Download PDF”.)

The CDC’s plan involves four stages. The first stage is implemented during mosquito season. This stage involves surveillance for suspected locally transmitted infections (i.e. persons with “symptoms compatible with Zika virus infection who do not have risk factors for acquisition through travel or sexual contact”, with pending test results). Upon a suspected infection, state officials and the CDC should be notified. State or local officials will open an epidemiological investigation (including ongoing surveillance) and begin implementing controls, involving both reducing mosquito populations and continuing public outreach, with CDC assistance as needed.

Stage 2 occurs upon confirmation of a locally transmitted infection. At this point, notification expands to include local blood centers as well as others required by International Health Regulations. The CDC will assist with an expanded investigation, surveillance, and communication, including deployment of an emergency response team (CERT) if desired. Once Stage 2 has been reached, stand down will only occur after 45 days (3 mosquito incubation periods) without additional infections or when environmental conditions no longer permit transmission.

If there is confirmed Zika in two or more persons whose movement during the exposure period overlaps within a one-mile diameter, Stage 3 (widespread local transmission) is entered. First, local officials will attempt to determine the transmission area, the “geographic area in which multiperson local transmission has occurred and may be ongoing”. Communication, surveillance, testing and controls are enhanced and expanded. Interventions for blood safety and vulnerable populations (including pregnant women) are implemented.

Once the infection has spread outside a county, it enters Stage 4 (widespread multijurisdictional transmission). All steps taken in previous stages are expanded and enhanced. The CDC will evaluate whether local capacity is adequate for response, and will assist as needed. Stage 4 actions will be continued until the criteria for stand down is met.

Based on previous experience with two mosquito-transmitted diseases, chikungunya & dengue fever, the CDC does not believe Stage 4 will be reached within the United States. However, as Dr. Tim F. Jones, an epidemiologist for the State of Tennessee, says, “Even though the percentages and the likelihoods are incredibly low, the outcome is awful.” Risk is a function of probability and consequence. Even with a low probability, the high consequence makes the risk from Zika considerable, and worth planning for.

To view the Process Map, click on “Download PDF” above. Or, click here to view the CDC’s interim guidance.

.

Millions of sippy cups recalled

By Kim Smiley

On May 27, 2016, it was announced that 3.1 million Tommee Tippee Sippee spill-proof cups were being recalled because of concerns about mold. The issue came to light after consumers called the company to complain about finding mold in children’s cups and several alarming photos of moldy cup valves were posted on the company’s Facebook page, some shared thousands of times. There have been more than three thousand consumer reports about mold forming in the cup valves, including 68 cases of illness that are consistent with consuming mold.

A Cause Map, a visual root cause analysis, can be built to better understand this issue. The first step in the Cause Mapping process is to fill in an Outline with the basic background information, including how the issue impacts the overall goals. In this case, the safety goal is impacted because 68 cases of illness have been reported. The regulatory call is impacted by the recall of the cups and the economic goal is impacted because of the high cost associated with recalling and replacing millions of cups. The time required to investigate and address the issue can be considered an impact to the labor/time goal. Additionally, the customer service goal is impacted because more than 3,000 consumers have reported mold in their sippy cups and because of the negative social media.

The next step in the Cause Mapping process is to build the Cause Map itself. The Cause Map is built by asking “why” questions and visually laying out the answers to show the cause-and-effect relationships. Understanding the many causes that contribute to an issue can help a broader range of solutions to be considered rather than focusing on a single “root cause” and focusing on solving only one issue. In this example, the mold is growing in the one-piece valve used in this model of cup. The valves remained moist, likely because they are not allowed to dry between uses, and they were not cleaned frequently enough to prevent mold growth. Many consumers have complained that it is very difficult or even impossible to adequately clean the cup valve which has contributed to the mold issue. In addition to the growth of the mold, one of the reasons children have gotten is sick is because it is hard to see the mold. Caregivers are unaware of the fact that the cups are moldy and continue to use them. (To see how these issue might be captured on a Cause Map, click on “Download PDF” above.)

The final step in the Cause Mapping process is to develop and implement solutions that will reduce the risk of the problem from reoccurring. In this case, all cup designs that use the single one-piece valve are being recalled and the valve replaced with either a trainer straw cup with no valve or a sippy cup with a new design two-piece valve that is easier to clean. The new two-piece valve comes apart in such a way that should also make it much easier to identify a potential mold issue, which should hopefully reduce the likelihood that a child will ingest mold. (If you think you may own one of these cups, you can get more information about how to get a replacement here.)

One of the interesting pieces of this case study is that the company has to work to address the technical issue with the valve design, but it also has to work to rebuild consumer trust. Consumers, especially when buying products for small children, will avoid a company if they don’t believe they take safety concerns seriously. This company has taken a beating online by outraged parents in the months leading up to the recall. In addition to designing a valve that will be less likely to harbor mold, it benefited the company to ensure the new design made it easy for parents to see that the cup valve was mold-free and safe. The company has also worked to spread information about the recall and tried to make it easy for consumers to get their recalled cups replaced. How a recall is handled has a huge impact on how consumers respond to the issue. A recall that isn’t handled well on top of an issue that has already shaken consumer trust can quickly spell disaster for a company. Consumers can be much more forgiving of an issue if a company responds quickly and if any necessary recalls are done as quickly and effectively as possible. It will be interesting to see how this company weathers this storm now that the cups have been recalled and the mold issue addressed.

Multiple Factors Contributing to Health Care Crisis in Venezuela

By ThinkReliability Staff

Venezuela is facing a health care crisis of massive proportions. Since 2012, the infant mortality rate has skyrocketed from 0.02% to more than 2%. (The latest numbers are from 2015, so this is a hundred-fold increase within 3 years.) The mortality rate for new mothers increased almost 5 times over the same period. Everyone else isn’t doing too well either. Says Dr. Yamila Battaglini, a surgeon at J. M. de los Ríos Children’s Hospital, “There are people dying for lack of medicine, children dying of malnutrition and others dying because there are no medical personnel.” That doesn’t even cover all of the problems facing Venezuela right now, which include:

Rolling blackouts: The government has announced official “rolling” blackouts of at least 40 days. That includes hospitals and other medical facilities. (Doctors are reporting having to work in the dark.) At least one hospital has a generator that doesn’t work. One reason electricity is being rationed is that even though money has been allocated to building new power plants, the plants aren’t online, and the money hasn’t been accounted for. (Unfortunately this kind of potential theft/ corruption is much too common in Venezuela). Another reason is . . .

Drought: The Guri hydroelectric dam provides 75% of the nation’s electricity, and currently has extremely low levels due to drought. The drought, caused by El Niño, has also resulted in a general lack of water, which is now being rationed. The combination means that the hospital doesn’t have adequate water supplies, resulting in . . .

Lack of sanitation: Without water, sanitation suffers. Doctors have reported performing surgery after a quick rinse from a water bottle, and no rinsing down of surgical beds or instruments before the next surgery, or procedure. But the people who are getting surgery or procedures are lucky, because many hospitals are also suffering from . . .

Shortages of medical personnel: Many medical professionals have left Venezuela during the severe ongoing economic issues (such as inflation, currently pegged at 700%) due to both the decreasing price of oil (Venezuela’s main export) and what have been called “disastrous” government policies. Says Ricardo Hausmann, Professor at the Kennedy School of Government (and Venezuela native), “Venezuela’s problems are a consequence of the craziest economic policy ever in a country or in the world. It’s a country that has gone through its longest and highest oil boom in its history, and ended that period over-indebted, with a destroyed productive capacity, and now it cannot face the reduction in the price of oil.” Doctors that remain face exhaustion – without water and power, many are attempting to save lives by manually operating equipment (such as respirators for newborns). Even this can’t save lives with . . .

Shortages of drugs and equipment: The Pharmaceutical Federal of Venezuela estimates that the country is lacking ~80% of needed basic medical supplies. Price controls in Venezuela resulted in official selling prices lower than manufacturing costs. This made it financially infeasible to provide many products. The government can’t afford to import drugs, and individuals have difficulty doing so because official currency exchange isn’t available. (Even if it was, Venezuelan money is virtually worthless at this point, as the government keeps printing more.) Theft and corruption have also resulted in the loss of some equipment. And as if this all weren’t enough, the country is also suffering from . . .

Zika outbreak: To a country that lacks almost all ability to provide health care, add an ongoing outbreak (see our previous blog) for which there is currently no cure, and you end up with a situation where “some come here healthy, and they leave dead.” (Dr. Leandro Pérez, Luis Razetti Hospital)

With this many (and this severe) problems, there are no easy answers. Making the situation even worse is the government’s denial that there IS a problem. Says President Nicolás Maduro, “I doubt that anywhere in the world, except in Cuba, there exists a better health system than this one.” This is preventing other countries from providing aid, sometimes because they are unaware the extent of the need. At least one country, India, is offering drugs for oil, though that may be mainly to recoup funds they are already owed, not for providing new medication.

In order to see the multitude of causes that have resulted in the health care crisis in Venezuela laid out in a visual cause-and-effect format, click on “Download PDF” above. Or click here to read more.

Hospital pays hackers ransom of 40 bitcoins to release medical records

By Kim Smiley

In February 2016, Hollywood Presbyterian Medical Center’s computer network was hit with a cyberattack.  The hackers took over the computer system, blocking access to medical records and email, and demanded ransom in return for restoring the system.  After days without access to their computer system, the hospital paid the hackers 40 bitcoins, worth about $17,000, in ransom and regained control of the network.

A Cause Map, an intuitive visual format for performing a root cause analysis, can be built to analyze this incident.  Not all of the information from the investigation has been released to the public, but an initial Cause Map can be created to capture what is now known.  As more information is available, the Cause Map can easily be expanded to incorporate it.

The first step in the Cause Mapping process is to fill in an Outline with the basic background information.  The bottom portion of the Outline has a place to list the impacts to the goals.  In this incident, as with most, more than one goal was impacted.  The patient safety goal was impacted because patient care was potentially disrupted because the hospital was unable to access medical records.  The economic goal was also impacted because the hospital paid about $17,000 to the hackers.  The fact that the hackers got away with the crime could be considered an impact to the compliance goal.  To view a filled-in Outline as well as a high level Cause Map, click on “Download PDF” above.

Once the Outline is completed, defining the problem, the next step is to build the Cause Map to analyze the issue. The Cause Map is built by asking “why” questions and laying out the answers to show all the cause-and-effect relationships that contributed to an issue.  In this example, the hospital paid ransom to hackers because they were unable to access their medical records.  This occurred because the hospital used electronic medical records, hackers blocked access to them and there was no back-up of the information.  (When more than one cause contributed to an effect, the causes are listed vertically on the Cause Map and separated with an “and”.)

How the hackers were able to gain access to the network hasn’t been released, but generally these types of ransomware attacks start by the hacker sending what seems to be routine email with an attached file such as a Word document. If somebody enables content on the attachment, the virus can access the system. Once the system is infected, the data on it is encrypted and the user is told that they need to pay the hackers to gain access to the encryption key that will unlock the system. Once the system has been locked up by ransomware, it can be very difficult to gain access of the data again unless the ransom is paid.  Unless a system is designed with robust back-ups, the only choices are likely to be to pay the ransom or lose the data.

The best way to deal with these types of attacks is to prevent them. Do not click on unknown links or attachments.  Good firewalls and anti-virus software may help if a person does click on something suspicious, but it can’t always prevent infection.  Many experts are concerned about the precedent set by businesses choosing to pay the ransom and fear these attacks may become increasingly common as they prove effective.

Shoveling snow really can trigger heart attacks

By Kim Smiley

You may have heard that shoveling snow can trigger a heart attack and studies have found that there is truth behind that concern.  Before you pick up a shovel this winter, there are a few things you should know.

Shoveling can be much more strenuous than many people realize – even more strenuous than running at full speed on a treadmill.  Snow shoveling also tends to be a goal-oriented task.  People want to clear the driveway before they stop and they may push their bodies beyond the point where they would if they were exercising for fitness.

Cold temperatures can increase the risk of heart problems occurring.  When a body gets cold, the arteries constrict and blood pressure can increase, which in turn increases the risk of heart issues.  High blood pressure and a sudden increase in physical activity can be a dangerous combination.  Additionally, it may take longer than normal for emergency help to arrive if it is needed because of snow and ice on the roadways which makes the situation potentially even more dangerous.

If you are young and fit, snow shoveling can be a great workout (and maybe you could help out your elderly neighbors if possible…), but if you are at risk of heart problems, you may want to put some thought into how you attack the problem of clearing your driveway and/or sidewalks.  First off, you should know if you are potentially at high risk.  Studies have found that people over 55 are four times more likely to experience heart-related issues while shoveling and men are twice as likely as women. People with known heart problems, diabetes or high blood pressure are also potentially high-risk.  Anybody who is sedentary is also at a higher risk of heart issues than somebody who exercises regularly.

So what should you do if you are concerned about the risk of heart problems and shoveling?  If possible, you may want to avoid shoveling if there is somebody else who can do it.  If you are determined to shovel yourself, make sure you drink lots of water and dress warmly.  Try to push the snow if possible, rather than shoveling it.  It is also generally better to shovel lots of lighter loads rather than fewer, heavy loads.  If possible, you may want to shovel several times throughout the storm to spread the work out over time. Take frequent breaks and stop immediately if you feel tired, lightheaded, short of breath or your chest hurts. Stay safe this winter!

To see a Cause Map, a visual root cause analysis, of this issue, click on “Download PDF” above.  A Cause Map visually lays out all the causes that contribute to an issue so that it can be better understood.  This example Cause Map also includes evidence and potential solutions.

Chipotle Improves Food Safety Processes After Outbreaks

By ThinkReliability Staff

On February 8, all Chipotle stores will close in order for employees to learn how to better safeguard against food safety issues.  This is just one step of many being taken after a string of outbreaks affected Chipotle restaurants across the United States in 2015.  Three E. coli outbreaks (in Seattle in July, across 9 states in October and November, and in Kansas and Oklahoma in December) sickened more than 50 customers.  There were also 2 (unrelated) norovirus outbreaks (in California in August and Boston in December) and a salmonella outbreak in Minnesota from August through September.

In addition to customers being sickened, the impacts to the company have been severe.  The outbreaks have resulted in significant negative publicity, reducing Chipotle’s share price by at least 40% and same-store sales by 30% in December.  Food from the restaurants impacted by the fall E. coli outbreak was disposed of during voluntary closings, and the company has invested in significant testing and food safety expertise.

E. coli typically sickens restaurant customers who are served food contaminated with E. coli. Food ingredients can enter the supply chain contaminated (such as the 2011 E. coli outbreak due to contaminated sprouts), or be contaminated during preparation, either from contact with a contaminated surface or a person infected with E. coli. While testing hasn’t found any contamination on any surfaces in the affected restaurants or any employees infected with E. coli, it hasn’t been able to find any contaminated food products either. While this is not uncommon (the source for the listeria outbreak that resulted in the recall of ice cream products has not yet been definitively determined), it does require more extensive solutions to ensure that any potential sources of contamination are eliminated.

Performing an investigation with potential, rather than known causes, can still lead to solutions that will reduce the risk of a similar incident recurring.  Potential or known causes can be determined with the use of a Cause Map, a visual form of root cause analysis.  To create a Cause Map, begin with an impacted goal and ask “Why” questions to determine cause-and-effect relationships.  In this case, the safety goal was impacted because people got sick from an E. coli outbreak.  A contaminated ingredient was served to customers.  This means the ingredient either entered the supply chain contaminated or it was contaminated during preparation, as discussed above.  In order for a contaminated ingredient to enter the supply chain, it has to be contaminated with E. coli, and not be tested for E. coli.  Testing all raw ingredients isn’t practical.

Chipotle is instituting solutions that will address all potential causes of the outbreak.  Weekly and quarterly audits, as well as external assessments will increase oversight.  Cilantro will be added to hot rice to decrease the presence of microbes.  The all-employee meeting on February 8 will cover food safety, including new sanitation procedures that will be used going forward.  The supply chain department is working with suppliers to increase sampling and testing of ingredients.  Certain raw ingredients that are difficult to test individually (such as tomatoes) will be washed, diced, and then tested in a centralized prep kitchen and shipped to individual restaurants.  Other fresh produce items delivered to restaurants (like onions) will be blanched (submerged in boiling water for 3-5 seconds) for sanitation prior to being prepared.

Chipotle has released a statement describing their efforts: “In the wake of recent food safety-related incidents at a number of Chipotle restaurants, we have taken aggressive actions to implement pioneering food safety practices. We have carefully examined our operations—from the farms that produce our ingredients, to the partners that deliver them to our restaurants, to the cooking techniques used by our restaurant crews—and determined the steps necessary to make the food served at Chipotle as safe as possible.”  It is hoped that the actions being implemented will result in the delivery of safe food, with no outbreaks, in 2016.

To view the impacts to the goals, timeline of outbreaks, analysis, and solutions, please click on “Download PDF” above.  Or click here to learn more.

The water crisis in Flint, Michigan

By Kim Smiley

The quality of tap water, or rather lack thereof, in Flint, Michigan has been all over headlines in recent weeks. But prior to a state of emergency being declared and the National Guard being called up, residents of the town reported strangely colored and foul tasting water for months and were largely ignored. In fact, they were repeatedly assured that their water was safe.

Researchers have determined that lead levels in the tap water in Flint, Michigan are 10 times higher than previously measured. Forty-three people have been found to have elevated lead levels in their blood and there are suspected to be more cases that have not been identified. Even at low levels, lead can be extremely damaging, especially to young children under 6. Lead exposure can cause neurological damage, decreased IQ, learning disabilities and behavior problems. The effects of lead exposure are irreversible.

The water woes in Flint, Michigan began when the city switched their water supply to the Flint river in April 2014. Previously, the city’s water came from Lake Huron (through the city of Detroit water system). The driving force behind the change was economics. Using water from the Flint river was cheaper and the struggling city needed to cut costs. Supplying water from the Flint River was meant to be a temporary move to hold the city over while a new connection to the Great Lakes was built within a few years.

The heart of the problem is that the water from the Flint river is more corrosive than the water previously used. The older piping infrastructure in the area used lead pipes in some locations as well as lead solder in some joints. As the more corrosive water flowed through the piping, the lead leached into the water.

A Cause Map, a visual root cause analysis, can be built to document what is known about this issue. A Cause Map intuitively lays out the cause-and-effect relationships that contributed to an issue. Understanding the many causes that contribute to an issue leads to better, more detailed solutions to address the problem and prevent it from reoccurring. The Flint water crisis Cause Map was built using publicly available information and is meant to provide an overview of the issue. At this point, most of the ‘whats’ are known, but some of the ‘whys’ haven’t been answered. It isn’t clear why the Flint river water wasn’t treated to make it less corrosive or why it took so long for officials to do something about the unsafe water. Open questions are noted on the Cause Map by including a box with a question mark in it.

This issue is now getting heavy media coverage and officials are working on implementing short-term solutions to ensure safety of the residents. The National Guard and other authorities are going door-to-door and handing out bottled water, water filters, and testing kits. Michigan Governor Richard Snyder declared a state of emergency in Flint on January 5, 2016 which allows more resources to be used to solve the issue. However, long-term solutions are going to be expensive and difficult.

The city’s water supply was switched back to Lake Huron in October 2015, but it will take more than that to “fix” the problem because there is still a concern about lead leaching from corroded piping. Significant damage to the piping infrastructure was done and the tap water in at least some Flint homes is still not safe. It is estimated that fixing the piping infrastructure could cost up to $1.5 billion. A significant amount of resources will be needed to undo the damage that has been done to the infrastructure of the city, and there is no way to undo the damage lead poisoning has already done to the area’s residents, especially the children.

Saving lives by helping parents remember

By ThinkReliability Staff

Vaccination programs that increased the worldwide availability of vaccines have resulted in an estimated 7 million children surviving who would otherwise have died of preventable disease since the year 2000. Preventable diseases are those that can be prevented with a proper vaccination schedule.

However, about 1 in 5 children miss recommended vaccinations, leading to an estimated 1.5 million deaths that still happen every year from preventable diseases. Although the vaccines are getting to medical facilities across the world, children still need to be brought to the vaccines.   Parents may choose not to have their children vaccinated, typically due to a concern about the side effects (as occurred in the Disneyland measles outbreak, the subject of a previous blog.)   In some cases, parents just forget about the increasingly complex vaccination schedule.

People forget things; it’s a fact of life. But when parents forget about recommended vaccines, preventable disease and potentially death can be the result. Various solutions have been implemented across the world to make sure that all children receive all recommended vaccines. Potential solutions are evaluated on how easy they are to implement and how effective their planned result. Ideal solutions (“low-hanging fruit” or “slam dunks”) are solutions that are very effective and simple to implement.

The effectiveness and ease of implementation of solutions is dependent upon the circumstances. For example, calling parents to remind them of their child’s vaccine schedule is pretty effective – but it’s far easier to implement in a developed country than in a developing country. Thus the same solution – a phone call – appears in the “low hanging fruit” quadrant in developed countries, and in the “capital project” for developing countries. Click on “Download PDF” above to see how a solutions matrix may look for this issue.

Other solutions that have been implemented across the globe to help ensure children get all their recommended vaccines include:

– An anklet that fits around a newborn’s ankle with a punch-out reminder for each vaccine that costs only 10 cents each and has been tested in Peru & Ecuador (91% of 150 mothers surveyed said the bracelets helped them remember)

– Town criers in the villages of Burkina Faso made announcements about meningitis vaccines and community health workers went door-to-door answering questions about the vaccine (11 million people aged 1 to 29 were vaccinated within 10 days)

– PATH, a nonprofit that works on vaccines, provides poster templates advertising the importance of vaccines

– Rotary International had vaccine announcements added to the skirts of women in Kenya

– In India, an extensive polio vaccination program including transit and follow-up teams which led to the country being removed from the endemic polio list (see our previous blog)

All of these solutions have the potential to reduce deaths from preventable disease by increasing vaccination rates. In this case, as in many others, the most effective solutions need to be selected carefully. “Cultures, leaders and messaging are different in each country. So you have to study and use what’s most likely to work in order to build trust that the vaccine will be helpful,” says Amrita Gill-Bailey a team leader at Johns Hopkins Center for Communication Programs.

New study finds that cholera vaccine helps protect community

By Kim Smiley

There are an estimated 3 to 5 million cases of cholera worldwide each year, believed to cause more than 100,000 deaths annually.  Cholera is rare in developed nations, but has been pandemic in Asia, Africa and Latin America for decades.  Researchers continue to search for an effective method to prevent cholera outbreaks.  A recent study found that a cheap oral vaccine is an effective tool to help prevent the spread of cholera.  The vaccine is not a perfect solution, but the study found that when two-thirds of the population was given the vaccine, cholera infections in an urban slum were reduced by nearly 40 percent.

The problem of cholera infections can be analyzed by building a Cause Map.  A Cause Map is a visual root cause analysis that intuitively lays out the cause-and-effect relationships of the multiple causes that contribute to an issue.  A Cause Map is built by asking “why” questions and documenting the answers in cause boxes.  To see how a Cause Map of this issue could be built, click on “Download PDF” above.

So why are so many people infected with cholera each year? Cholera is not generally passed from person to person and is predominantly spread through drinking water contaminated with cholera bacterium.  The feces of an infected individual carry cholera bacterium.  Cholera outbreaks occur in areas where there is a person infected with cholera in a location with poor sanitation infrastructure and inadequate water treatment.

Many efforts to reduce the number of cholera cases have focused on providing clean drinking water and providing sanitization equipment.  A recent study looked at three populations in Bangladesh: one was only given the vaccine, the second was given the vaccine, a hand-washing station and taught how to sterilize drinking water, and no intervention was done on the third population. The results showed that the vaccine alone was nearly as effective at preventing cholera as providing the vaccine along with a hand-washing station and instructions on sterilizing drinking water.  In the study, people were given two doses of the vaccine which costs about $3.70.

In an ideal world everyone would have access to clean, safe drinking water, but the resources required to build the needed infrastructure are not likely to be available any time in the near future.  Having a relatively cheap vaccine that is proven to slow the spread of cholera during an outbreak should prove to be a powerful tool in situations where access to clean water is limited.