Tag Archives: solutions

Patient receives double dose of radiotherapy

By ThinkReliability Staff

The risk associated with medical treatment administration is high. There is a high probability for errors because of the complexity of the process involved in not only choosing a treatment, but ensuring that the amount and rate of treatment is appropriately calculated for the patient. The consequence associated with treatment errors is significant – death can and does result from inappropriately administered treatment.

Medical treatment includes delivery of both medication and radiation. Because of the high risk associated with administering both medication and radiation therapy, independent checks are frequently used to reduce risk.

Independent checks work in the following way: one trained healthcare worker performs the calculation associated with medical treatment delivery. If the treatment is then delivered to the patient, the probability that a patient will receive incorrect treatment is the error rate of that healthcare worker. (For example, a typical error rate for highly trained personnel is 1/1,000. If only one worker is involved with the process, there is a 0.1% chance the patient will receive incorrect treatment.) With an independent check, a second trained worker performs the same calculations, and the results are compared. If the results match, the medication is administered. If they don’t, a secondary process is implemented. The probability of a patient receiving incorrect treatment is then the product of both error rates. (If the second worker also has an error rate of 1/1,000, the probability that both workers will make an error on the same independently performed calculation is 1/1,000 x 1/1,000, or 0.0001%.)

However, in a case last year in Scotland, a patient received a significant radiotherapy overdose despite the use of independent checks, and verification by computer.   In order to better understand how the error occurred, we can visually diagram the cause-and-effect relationships in a Cause Map. The error in this case is an impact to the patient safety goal, as a radiotherapy overdose carries a significant possibility of serious harm. The Cause Map is built by starting at an impacted goal and asking “why” questions. All causes that result in an effect should be included on the Cause Map.

In this case, the radiotherapy overdose occurred because the patient was receiving palliative radiotherapy, the incorrect dose was entered into the treatment plan, and the incorrect dose was not caught by verification methods. Each of these causes is also an effect, and continuing to ask “Why” questions will develop more cause-and-effect relationships. The incorrect dose was entered into the treatment plan because it was calculated incorrectly (but the same) by two different radiographers working independently. Both radiographers made the same error in their manual calculations. This particular radiotherapy program involved two beams (whereas one beam is more common). The dose for each beam then must be divided by two (to ensure the overall dose is as ordered). This division was not performed, leading to a doubled calculated dose. The inquiry into the overdose found that both radiographers used an old procedure which was confusing and not recommended by the manufacturer of the software that controlled the radiotherapy delivery. While a new procedure had been implemented in February 2015, the radiographers had not been trained in the new procedure.

Once the two manual calculations are performed, the treatment plan (including the dose) was entered into the computer (by a third radiographer). If the treatment plan does not match the computer’s calculations, the computer sends an alert and registers an error. The treatment plan cannot be delivered to the patient until this error is cleared. The facility’s process at this point involves bringing in a treatment planner to attempt to match the computer and calculated doses. In this case, the treatment planner was one of the radiographers who had first (incorrectly) performed the dose calculation. The radiographers involved testified that alerts came up frequently, and that any click would remove them from the screen (so sometimes they were missed altogether).

The inquiry found that somehow the computer settings were changed to make the computer agree with the (incorrect) manual calculations, essentially performing an error override. The inquiry found that the radiographers involved in the case believed that the manually calculated dose was correct, likely because they didn’t understand how the computer calculated doses (not having had any training on its use) and held a general belief that the computer didn’t work well for calculating two beams.

As a result of this incident, the inquiry made several recommendations for the treatment plan process to avoid this type of error from recurring. Specifically, the inquiry recommended that the procedure and training for manual calculation be improved, independent verification be performed using a different method, procedures for use of the computer be improved (including required training on its use), and requiring manual calculations to be redone when not in agreement with the computer. All of these solutions will reduce the risk of the error occurring.

There is also a recommended solution that doesn’t reduce the risk of having an error, but increases the probability of it being caught quickly. This is to outfit patients receiving radiotherapy with a dosimeter so their received dose can be compared with the ordered dose. (In this case, the patient received 5 treatments; had a dosimeter been used and checked the error would likely have been noticed after only one.)

To view the Cause Map for this incident, please click on “Download PDF” above.

CDC provides guidance for states to respond to Zika cases

By ThinkReliability Staff

The first Zika cases related to the current outbreak were found in Brazil in May 2015, along with a dramatic increase in microcephaly in babies born in that year. (See our previous blog about the possible link – now verified – between Zika and microcephaly.) Microcephaly is a serious birth defect that impacts many children whose mothers contract Zika while pregnant.

Active Zika transmission currently exists in nearly all of South and Central America, the Caribbean, and some Pacific Islands. 934 people in the US have been infected with Zika; 287 of those infected are pregnant women. Most of these people were infected outside the country and then traveled to the US. Zika is primarily spread by mosquitos, but can also be transmitted through blood transfusion, laboratory exposure and sexual contact.

While no cases of transmission by mosquito have yet been reported in the continental US, the Centers for Disease Control and Prevention (CDC) has released a blueprint for states to respond to locally transmitted cases of Zika. A visual diagram outlining the steps to be taken from the blueprint (a Process Map) can be helpful. (To view the Process Map for the CDC’s interim Zika response process, click on “Download PDF”.)

The CDC’s plan involves four stages. The first stage is implemented during mosquito season. This stage involves surveillance for suspected locally transmitted infections (i.e. persons with “symptoms compatible with Zika virus infection who do not have risk factors for acquisition through travel or sexual contact”, with pending test results). Upon a suspected infection, state officials and the CDC should be notified. State or local officials will open an epidemiological investigation (including ongoing surveillance) and begin implementing controls, involving both reducing mosquito populations and continuing public outreach, with CDC assistance as needed.

Stage 2 occurs upon confirmation of a locally transmitted infection. At this point, notification expands to include local blood centers as well as others required by International Health Regulations. The CDC will assist with an expanded investigation, surveillance, and communication, including deployment of an emergency response team (CERT) if desired. Once Stage 2 has been reached, stand down will only occur after 45 days (3 mosquito incubation periods) without additional infections or when environmental conditions no longer permit transmission.

If there is confirmed Zika in two or more persons whose movement during the exposure period overlaps within a one-mile diameter, Stage 3 (widespread local transmission) is entered. First, local officials will attempt to determine the transmission area, the “geographic area in which multiperson local transmission has occurred and may be ongoing”. Communication, surveillance, testing and controls are enhanced and expanded. Interventions for blood safety and vulnerable populations (including pregnant women) are implemented.

Once the infection has spread outside a county, it enters Stage 4 (widespread multijurisdictional transmission). All steps taken in previous stages are expanded and enhanced. The CDC will evaluate whether local capacity is adequate for response, and will assist as needed. Stage 4 actions will be continued until the criteria for stand down is met.

Based on previous experience with two mosquito-transmitted diseases, chikungunya & dengue fever, the CDC does not believe Stage 4 will be reached within the United States. However, as Dr. Tim F. Jones, an epidemiologist for the State of Tennessee, says, “Even though the percentages and the likelihoods are incredibly low, the outcome is awful.” Risk is a function of probability and consequence. Even with a low probability, the high consequence makes the risk from Zika considerable, and worth planning for.

To view the Process Map, click on “Download PDF” above. Or, click here to view the CDC’s interim guidance.

.

Man Paralyzed By Medical Error Hopes to Fix System for Others

By ThinkReliability Staff

The team investigating medical errors that happened at a Washington hospital has an unusual member: the man who was paralyzed as a result of these medical mistakes.  Not only does he want to know what happened, he hopes that his design experience (he formerly designed for Microsoft) can be translated to healthcare to “make hospitals everywhere safer for patients.”

While the full analysis of his particular case is not yet complete, the information that is known can be captured in a Cause Map, a visual form of root cause analysis.  The process begins by capturing the what, when and where of the incident, as well as the impact to the organization’s goals.  In this case, treatment was at a Washington hospital’s emergency room for a back injury obtained May 11, 2013. The interaction with the facility involved a missed diagnosis, poor communication, and eventually resulted in paralysis to the patient.  In this case the patient safety goal is impacted due to the paralysis of the patient.  The financial goal is impacted due to a $20 million settlement against the hospital. (Part of the settlement included the hospital working with the patient on the analysis.)  The labor/ time goal is impacted due to the months of rehabilitation required after the injury.

The second step of the process, the analysis, develops cause-and-effect relationships beginning with one of the impacted goals.  In this case, the patient safety goal was impacted due to the paralysis of a patient. The paralysis resulted from a spinal cord injury, which was caused by a significant back fracture.  There are times when more than one cause is required to produce an effect.  The significant back fracture was caused by an untreated hairline fracture on the back AND the patient being moved inappropriately.  If either of these things had not occurred, the outcome may have been very different.  The analysis continues by asking ‘why’ questions of both the causes.

The patient had a hairline fracture on his back that resulted from a fall out of bed (due to “luxurious sheets”) and a condition (ankylosing spondylitis), which makes the spine brittle and more prone to fractures.  Beginning on May 12, 2013, the patient visited the hospital’s emergency room four times in two weeks. The hairline fracture was untreated because it was not diagnosed during any of those visits, despite the patient’s insistence that, because of his condition, he was concerned about the possibility of a back fracture.  While the hairline fracture is visible on the imaging scan, according to the patient’s lawyers, it was missed because the scan was focused on the abdomen.  The notes from the first doctor’s visit were not documented until 5 days after the encounter.

On May 25, 2013, two weeks after the initial injury, the patient returned to the emergency room for severe pain and an MRI was ordered.  While being positioned in the MRI, the patient lost neurological function from about the neck down.  He was transferred to another hospital, who found it likely that the paralysis had resulted from being positioned in the MRI.

The patient was inappropriately moved, given his injury (which at this point was still undiagnosed and untreated).  The patient was being positioned for an MRI ordered to find the cause of his back pain (probably due to the untreated hairline fracture of his back).  Either the previous imaging scan was not reviewed by the doctors at this visit, or the scan was unavailable.  Had the imaging scan indicating a hairline fracture been available, the MRI may not have been necessary. If the patient was given an MRI anyway, the staff would have been aware of the fracture and would likely have moved the patient more carefully.

However, the staff was not aware of the injury.  The patient’s repeated concern over having a back fracture was unheeded during all his visits, and the staff appeared to be unaware of the medical information from the three previous visits, likely due to ineffective communication between providers (a common issue in medical errors).

As more detail regarding the case is discovered, it can be added to the Cause Map.  Once all the information related to the case is captured, solutions that would reduce the risk of the problem recurring can be developed and those that are most effective can be implemented.  The patient will be a part of this entire process.

To view the initial Cause Map of this issue, click on “Download PDF” above. Or click here to read more.

The end of the Guinea worm?

By Kim Smiley 

Guinea worm disease is poised to become the second human disease to be eradicated (after smallpox). In the 1980s, there were millions of cases of Guinea worm disease each year and the number has plummeted to only two confirmed cases so far in 2016, both believed to have been contained before the disease had a chance to spread. This accomplishment is particularly impressive considering that there is no cure or vaccine for Guinea worm disease. In fact, the most effective “cure” for the disease used today is the same one that has been used for thousands of years – to wrap the worm around a stick and slowly pull it out. (Read our previous blog “Working to Eradicate a Painful Parasite” to learn more about the problems caused by Guinea worm disease.)

So how has this horrible disease been fought so effectively?  We need to understand how the disease spreads to understand how the cycle was broken.  (Click on “Download PDF” to see a Process Map of the Guinea worm lifecycle.) The Guinea worm is a human parasite that spreads from host to host through the water supply.  The (rather disgusting) lifecycle begins with Guinea worm embryos squirming and wiggling in a freshwater pond, hoping to attract the attention of unsuspecting water fleas.  Once consumed by a water flea, the Guinea worm embryos drill out of the water flea’s digestive tract, move around the body cavity and feed on the water flea.  When a human then drinks the water containing the infected water flea, the lifecycle continues.

The water flea is dissolved by digestive juices in the human’s stomach and the Guinea worm embryo drills out of the intestines and crawls into the abdominal blood vessels, remaining in the body for several months until it reaches sexual maturity.  If the human is unlucky enough to be hosting both a male and female Guinea worm, the parasites will mate.  The male then die and millions of embryos grow in the female.  The female worm will usually make her way to the host’s leg or foot, pierce the skin and release an irritant that creates a painful blister.

Human hosts will often put the fiery blister into water to soothe the pain.  The female worm senses the water and releases thousands of embryos from her mouth.  She doesn’t release all her embryos at once, but will continue to release embryos when she senses water over a period of time.  If the embryos happen to land in a pond with water fleas, the whole painful process can start anew.

Once the lifecycle of the Guinea worm was understood, communities and aid organizations were able to use the information to disrupt the lifecycle and prevent the Guinea worm from spreading.  Some aid organizations helped provide access to clean drinking water or straws with filters that removed water fleas and prevented Guinea worm infections. In other places, the Guinea worm larvae were killed by treating the water with larvicide. But the most effective solution has been simply keeping infected people out of the water supply.  Once most people understood the consequence of putting Guinea worm blisters in drinking water they simply (if painfully) avoided the ponds used for drinking water, but some communities also implemented new laws and fines or posted guards at water holds to ensure that no infected individuals went into the water. These methods have proven very effective and the Guinea worm is now one of the most endangered animals on the planet.

The key to fighting the Guinea worm was education. The most effective solutions were simple and low-tech. No modern vaccine or modern medical knowledge was needed to prevent Guinea worm infections, just knowledge about how the disease spread. Guinea worms have been infecting people for millions of years (they have even been seen in Egyptian mummies), and the lifecycle could have been broken long ago if it had been better understood.

Millions of sippy cups recalled

By Kim Smiley

On May 27, 2016, it was announced that 3.1 million Tommee Tippee Sippee spill-proof cups were being recalled because of concerns about mold. The issue came to light after consumers called the company to complain about finding mold in children’s cups and several alarming photos of moldy cup valves were posted on the company’s Facebook page, some shared thousands of times. There have been more than three thousand consumer reports about mold forming in the cup valves, including 68 cases of illness that are consistent with consuming mold.

A Cause Map, a visual root cause analysis, can be built to better understand this issue. The first step in the Cause Mapping process is to fill in an Outline with the basic background information, including how the issue impacts the overall goals. In this case, the safety goal is impacted because 68 cases of illness have been reported. The regulatory call is impacted by the recall of the cups and the economic goal is impacted because of the high cost associated with recalling and replacing millions of cups. The time required to investigate and address the issue can be considered an impact to the labor/time goal. Additionally, the customer service goal is impacted because more than 3,000 consumers have reported mold in their sippy cups and because of the negative social media.

The next step in the Cause Mapping process is to build the Cause Map itself. The Cause Map is built by asking “why” questions and visually laying out the answers to show the cause-and-effect relationships. Understanding the many causes that contribute to an issue can help a broader range of solutions to be considered rather than focusing on a single “root cause” and focusing on solving only one issue. In this example, the mold is growing in the one-piece valve used in this model of cup. The valves remained moist, likely because they are not allowed to dry between uses, and they were not cleaned frequently enough to prevent mold growth. Many consumers have complained that it is very difficult or even impossible to adequately clean the cup valve which has contributed to the mold issue. In addition to the growth of the mold, one of the reasons children have gotten is sick is because it is hard to see the mold. Caregivers are unaware of the fact that the cups are moldy and continue to use them. (To see how these issue might be captured on a Cause Map, click on “Download PDF” above.)

The final step in the Cause Mapping process is to develop and implement solutions that will reduce the risk of the problem from reoccurring. In this case, all cup designs that use the single one-piece valve are being recalled and the valve replaced with either a trainer straw cup with no valve or a sippy cup with a new design two-piece valve that is easier to clean. The new two-piece valve comes apart in such a way that should also make it much easier to identify a potential mold issue, which should hopefully reduce the likelihood that a child will ingest mold. (If you think you may own one of these cups, you can get more information about how to get a replacement here.)

One of the interesting pieces of this case study is that the company has to work to address the technical issue with the valve design, but it also has to work to rebuild consumer trust. Consumers, especially when buying products for small children, will avoid a company if they don’t believe they take safety concerns seriously. This company has taken a beating online by outraged parents in the months leading up to the recall. In addition to designing a valve that will be less likely to harbor mold, it benefited the company to ensure the new design made it easy for parents to see that the cup valve was mold-free and safe. The company has also worked to spread information about the recall and tried to make it easy for consumers to get their recalled cups replaced. How a recall is handled has a huge impact on how consumers respond to the issue. A recall that isn’t handled well on top of an issue that has already shaken consumer trust can quickly spell disaster for a company. Consumers can be much more forgiving of an issue if a company responds quickly and if any necessary recalls are done as quickly and effectively as possible. It will be interesting to see how this company weathers this storm now that the cups have been recalled and the mold issue addressed.

Particulate Matter Closes Operating Rooms at VA Hospital

By ThinkReliability Staff

On February 17, 2016, the 5 operating rooms at a New York Veterans Affairs (VA) hospital were closed due to particulates falling from the air ducts. An internal email from the engineer & safety officer to administrators at the hospital described the problem as this: “The dust is depositing on HVAC registers, ceilings, walls, and on medical equipment. Maintenance continues to clean the surfaces but, as the staff has observed, the dust reappears within a short time. At least three staff members have indicated their concern that this environment has affected them. They have been sent to employee health and to their individual physicians.”

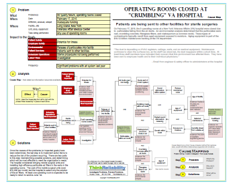
The information related to this issue determined as part of the incident investigation can be captured within a Cause Map, a visual form of root cause analysis. The first step of the process is to determine the impacts to the goals. In this case, both patient and employee safety are impacted due to the risk of illness from exposure to the particulates. The environmental goal is impacted because of the release of the particulates into the facility. Patient services are impacted because patients are being sent to other facilities as sterile procedures are not being performed (an impact to the production/ schedule goal). The labor and time required for an investigation is also an impact to the goal.

The second step of the process is the analysis: determining why these goals were impacted. The release of the particulates into the facility is because there are particulates within the air ducts, and the air ducts open into the facility to provide heating, ventilation and air conditioning. In order to determine where the particulates come from, first it must be determined what they are composed of. An environmental analysis determined that the particulates were rust, crumbling concrete, fiberglass fibers, and cladosporium (a common mold).

The analysis also identified that rust in air systems typically results from aged equipment exposed to moisture. Cladosporium also results from exposure to moisture. The air duct system pulls in outside air, including humidity, resulting in the system being exposed to moisture. The VA hospital is 45 years old, which actually makes it one of the “newer” VA facilities. (According to the VA, about 60% of its facilities are more than 60 years old.) While it’s unclear what maintenance or replacements have been performed on these components over the life of the facility, deferred maintenance is a general problem at VA facilities. According to the VA inspector general, there is a $10-12 billion maintenance backlog at the department.

Once the causes of the problems (or impacted goals) have been determined, the last step is to implement action items to reduce the risk of the problem recurring. There are two parts to this step: brainstorming possible solutions, and determining which will be most effective to meet the organization’s needs. The hospital considered bringing in mobile surgical units and installing high efficiency particulate air filters in the vents in the operating rooms. The cost of the mobile surgical units (over $70,000 per month) led the hospital to select only the solution of the air filters. At least one operating room is expected to be ready to return to service June 1st.

To view a one-page downloadable PDF of the incident investigation, including the impacted goals, analysis with evidence, and possible solutions, please click on “Download PDF” above.

NIH suspends work at two facilities

By Kim Smiley

Research has been suspended at two National Institutes of Health (NIH) facilities – a National Cancer Institute laboratory working on cell therapy production and a National Institute of Mental Health facility that makes positron emission tomography materials – over concerns about patient safety. A panel of experts determined that these facilities were not in compliance with quality and safety standards and they are shut down pending a review and any necessary upgrades.

A Cause Map, a visual format for root cause analysis, can be built to help understand this issue.  The first step in the Cause Mapping process is to fill in an Outline with the basic background information for an issue, along with how the issues impacts the overall goals. Thankfully, no patient harm has been identified as a result of issues at the facilities, but the potential for patient harm existed and potential impacts should be included on the Outline. No new patients will be enrolled in the affected trials until the issues are resolved and this is an impact to the schedule/operations goal. Once the Outline is complete, the Cause Map is then built by asking “why” questions and the answers are laid out to visually show the cause-and-effect relationships. (Click on “Download PDF” to see a completed Outline and high level Cause Map of this issue.)

So why was work at two NIH facilities shut down? A little background is needed to understand this issue. In April 2015, fungal contamination was found in products that were supposed to be sterile that were prepared at a different NIH facility, the Clinical Center’s Pharmaceutical Development Service. The investigation into the contaminated product found multiple deficiencies, both in the facility itself and in work practices. The deficiencies included a filter missing in an air handling system and insects found in two light bays in clean rooms. (Read our previous blog to learn more.) Following this issue, the director of NIH appointed a panel of experts to review safety compliance at all other NIH facilities that produce sterile or infused products for administration to research participants.

The panel’s evaluation is still underway, but preliminary findings determined that the two facilities in question are not in compliance with quality and safety standards and production has been suspended as a result.  The panel found that NIH has many outdated or inadequate facilities and that personnel lack expertise on applicable regulations, but no specific details about the deficiencies found have been released. NIH plans to do a rigorous review to identify and correct issues found before these facilities resume manufacturing sterile products. No timeline has been given at this point.

The final step in the Cause Mapping process is to identify and implement solutions to reduce the risk of similar errors reoccurring in the future. In addition to correcting the deficiencies found at these facilities, NIH is working on creating more oversight to help ensure manufacturing facilities are in compliance with safety regulations. The panel recommended the creation of both an outside hospital board to oversee the clinical center and a new central office to coordinate research quality and safety oversight.

Only time will tell how effective these solutions prove to be, but I find it promising that NIH proactively reviewed all of the facilities that produce sterile or infused products for administration to research participants following the fungal contamination issues last year.  It may be painful and embarrassing to suspend work at facilities, but the process is at least moving in the right direction if problems can be corrected before patients are harmed.

Death from Patient-Controlled Morphine Overdose

By ThinkReliability Staff

Could improving the reliability of the supply chain improve patient safety?

The unexpected death of a patient at a medical facility should always be investigated to determine if there are any lessons learned that could increase safety at that facility. A thorough analysis is important to determine all the lessons that can be learned. For example, the investigation into a case where a patient death was caused by a morphine overdose delivered by a patient-controlled analgesia (PCA) found that increasing the reliability of the supply chain, as well as other improvements, could increase patient safety.

The information related to this patient death was presented as a morbidity and mortality case study by the Agency for Healthcare Research and Quality. The impacts to goals, analysis, and lessons learned from the case study can be captured in a Cause Map, a visual form of root cause analysis that develops the cause-and-effect relationships in sufficient detail to be able to find solutions that will reduce the risk of similar incidents recurring.

Problem-solving methodologies such as Cause Mapping begin with defining the problem. In the Cause Mapping method, the what, when and where of the problem is captured, as well as the impact to the goals, which defines the problem. In this case, the patient safety goal is impacted due to the death of a patient. Because the death of a patient under medical care can cause healthcare providers to be second victims, this is an impact to the employee safety goal. A death associated with a medication error is a “Never Event“, which is an impact to the compliance goal. The morphine overdose is an impact to the patient services goal. In this case, the desired medication concentration (1 mg/mL morphine) was not available, which can be considered an impact to the property goal. Lastly, the response and investigation are an impact to the labor/time goal.

The analysis begins with one impacted goal and developing cause-and-effect relationships. One way to do this is by asking “Why” questions, but it’s also important to ensure that the cause listed is sufficient to have resulted in the effect. If it’s not, another cause is required, and will be joined with an “AND”. In this case, the patient death resulted from a morphine overdose AND a delayed response to the patient overdose. (If the response had come earlier, the patient might have survived.) It’s important to validate causes with evidence where possible. For example, the morphine overdose is a known cause because the autopsy found a toxic concentration of morphine. Each cause in the Cause Map then becomes an effect for which causes are captured until the Cause Map is developed to the point where effective solutions can be found.

The available information suggests that the patient was not monitored by any equipment, and that signs of deep sedation, which preceded respiratory depression, were missed during nurse checks. Related suggestions for promoting the safe use of PCA include the use of monitoring technology, such as capnography and oximetry, and assessing and recording vital signs, including depth of respiration, pain and sedation.

The patient in this case was given PCA morphine. However, too much morphine was administered. The pump settings were based on the concentration of morphine typically used (1 mg/mL).   However, that concentration was not available, so a much higher concentration (5 mg/mL) was used instead. The settings on the pump were entered incorrectly for the concentration of morphine used, likely because of confirmation bias (effectively assuming that things are the way they always are – that the morphine on the shelf will be the one that’s usually there). There was no effective double check of the order, medication and pump settings.

Related suggestions for promoting the safe use of PCA include the use of “smart” pumps, which suspend infusion when physiological parameters are breached, the use of barcoding technology for medication administration (which would have flagged the use of a different concentration), performing an independent double check, storing only one concentration of medications in a dispensing cabinet (requiring other concentrations to be specially ordered from the pharmacy), standardizing and limiting concentrations used for PCA, and yes, improving the supply chain so that it’s more likely that the lower concentration of morphine will be available. Any of these suggestions would improve patient safety; implementation of more than one solution may be required to reach an acceptable level of risk. Imagine just improving the supply chain so that there would be very few (if any) circumstances where the 1 mg/mL concentration of morphine is unavailable. Clearly the risk of using the wrong concentration would be lessened (though not zero), which would reduce the potential for patient harm.

To view a one-page downloadable PDF with the outline, Cause Map, and action items, click “Download PDF” above. Click here to read the case study.

“Desensitization” Process Improves Compatibility of Donor Kidneys

By ThinkReliability Staff

Many patients with advanced and permanent kidney failure are recommended for kidney transplants, where a donor kidney is placed into their body. Because most of us have two kidneys, donor kidneys can come from either living or deceased donors. If a compatible living donor is not found, a patient is placed on the waiting list for a deceased donor organ. Unfortunately, there are about 100,000 people on that waiting list. While waiting for a new kidney, patients must undergo dialysis, which is not only time-consuming but also expensive.

Researchers estimate that about 50,000 people on the kidney transplant waiting list have antibodies that impact their ability to find a compatible donor kidney. Of those, 20,000 are so sensitive that finding a donor kidney is “all but impossible” . . . .until now.

A study published March 9, 2016 in the New England Journal of Medicine provides promising results from a procedure that alters patients’ immune systems so they can accept previously “incompatible” donor kidneys. This procedure is called desensitization. First, antibodies are filtered out of a patient’s blood. Then the patient is given an infusion of other antibodies. The immune system then regenerates its own antibodies which are, for reasons as yet unknown, less likely to attack a donated organ. (If there’s still a concern about the remaining antibodies, the patient is treated with drugs to prevent them from making antibodies that may attack the new kidney.)

The study examined 1,025 patients with incompatible living donors at 22 medical centers and compared them to an equal number of patients on waiting lists or who received a compatible deceased donor kidney. After 8 years, 76.5% of the patients who were desensitized and received an “incompatible” living donor kidney were alive compared to only 43.9% of those who remained on the waiting list and did not receive a transplant.

The cost for desensitization is about $30,000 and a transplant costs about $100,000. However, this avoids the yearly life-long cost of $70,000 for dialysis. The procedure also takes about two weeks, so patients must have a living donor. The key is that ANY living donor will work, because the desensitization makes just about any kidney suitable, even for those patients who previously would have had significant trouble finding a compatible organ. Says Dr. Krista L. Lentin, “Desensitization may be the only realistic option for receiving a transplant.”

The study discusses only kidney transplants but there’s hope that the process will work for living-donor transplants of livers and lungs. Although the study has shown great success, the shortage of organ donations – of all kinds – is still a concern.

To view the process map for kidney failure without desensitization, and how the process map can be improved with desensitization, click on “Download PDF” above. To learn more about other methods to increase the availability of kidney donations, see our previous blog on a flushing process that can allow the use of kidneys previously considered too damaged for donation.


Study finds many patients don’t understand their discharge instructions

By Kim Smiley 

Keeping patients as comfortable and safe as possible following hospitalization is difficult if they aren’t receiving appropriate follow-up care after returning home.  But a recent study “Readability of discharge summaries: with what level of information are we dismissing our patients?” found that many patients struggle to understand their follow-up care instructions after leaving the hospital.  

Generally, follow-up care instructions are verbally explained to patients prior to discharge, but many find it difficult to remember all the necessary information once they return home.  The stress of the hospitalization, memory-clouding medication, injuries that may affect memory and the sheer number of instructions can make remembering the details of verbal follow-up care instructions difficult. 

In order to help patients understand and remember their recommended discharge instructions, written instructions are provided at the time of discharge.  However, the study found that many patients cannot understand their written follow-up care instructions.  The study determined that a significant percentage of patients are either functionally illiterate or marginally literate and lack the reading skills necessary to understand their written instructions.  One assessment found that follow-up care instructions were written at about a 10th grade level and another assessment determined that the instructions should be understood by 13 to 15-year-old students.  

One of the causes that contributes to this problem is that discharge instructions are written with two audiences in mind – the patient and their family as well as their doctor.  Many patients need simple, clear instructions, but other doctors understand medical jargon and more complicated care instructions.  

It is important to note that the study did have several limitations.  Researchers did not give patients reading tests and instead relied on the highest level of education attained to estimate literacy skills.  Non-English speakers were excluded.  Even with this limitation, the study provided information that should help medical professionals provide clear guidance on follow-up care recommendations. 

The obvious solution is to work towards writing care instructions that are as simple and clear to understand as possible. In order to help patients clearly understand their follow-up care instructions, the American Medical Association already recommends that health information be written at a sixth grade reading level.  Providing clear contact information and encouraging patients to call their nurse or doctor with any questions about discharge instructions could also improve the follow-up care patients are receiving.